Download
1 / 18
190 likes | 683 Views
Diagnosis of road accident problems. Hossein Naraghi CE 590 Special Topics Safety March 2003. Time Spent: 6 hrs. Diagnosis of road accident problems. After identifying the high risk locations, it is necessary to carefully examine the nature of the safety problem

E N D
Diagnosis of road accident problems Hossein Naraghi CE 590 Special Topics Safety March 2003 Time Spent: 6 hrs
Diagnosis of road accident problems • After identifying the high risk locations, it is necessary to • carefully examine the nature of the safety problem • Identify if those problems can be dealt with through traffic remedial measures
Process of diagnosis • UK institute of Highway and Transportation (1990) suggested six steps in diagnosis phase • Detail study of crash reports • Data storage to determine groups of crash types and their locations • Gather more detailed data by on-site investigation • Detailed analysis of all data • Identifying major factors • Determine the nature of the crash
Process of diagnosis (continued) • Most crash investigations involves two aspects • In-office analysis to identify the predominant vehicle maneuvers and the crash types occurring • The purpose is to identify needed countermeasures • On-site analysis by observing road feature and driver behavior
Data analysis and presentation • The source of data for crash investigation is the mass crash database which is used to identify hazardous road locations (HRL) • The output of this phase is a set of candidate sites which need some further investigation • Diagnosis step involves further analysis of data to achieve an appropriate level of familiarity with concerned sites to develop countermeasures in a systematic way
Accident history • Site and route studies • These studies relate to specific locations • Key step is to identify the patterns of crash types which will lead to identification of underlying problems • Dominant crash types provide the most reliable guide to the remedial action, since they are likely to be indicative of the future crash patterns at the site if it is not treated
Accident history (continued) • Supplementary analyses include investigation of frequency with which crashes occur according to a range of environmental or other characteristics • Light condition • To find out f particular visibility is the cause of the problem • Road condition (wet, dry) • To see the evidence of skidding • Time of day • To see if problem associated with morning peak, afternoon peak, or off-peak traffic and maneuvers • Day of week • To see if problem associated with particular user groups • e. g. party goers on Saturday night, tourists on Sunday afternoon
Accident history (continued) • Mass action studies • The focus is not on a particular site • Accidents may be stored by accident type to identify the locations where particular type of accident, candidate for standard treatment is occurring • Examples with possible countermeasures • Intersection crashes involving skidding • Skid resistance pavements • Collisions with bridge or structure • Guard fencing and delineation
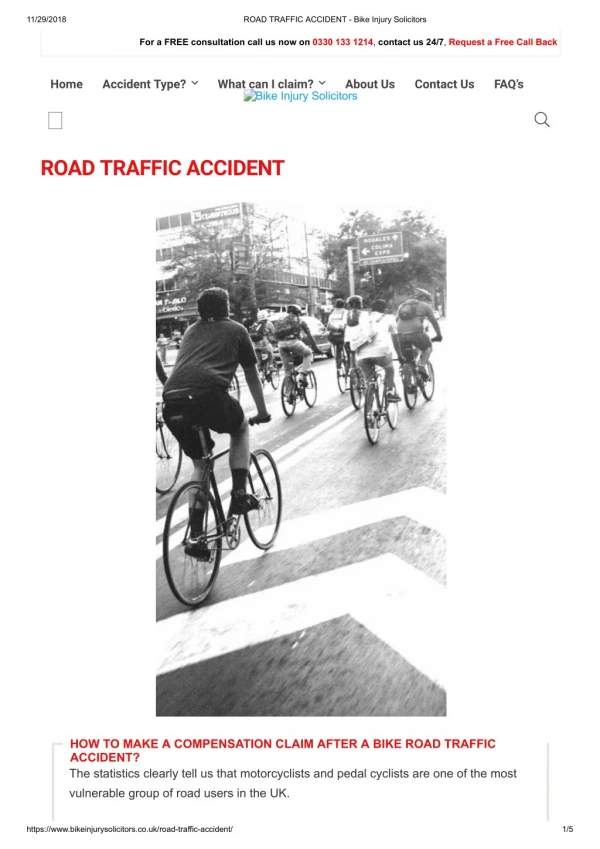
Accident history (continued) • Rural single vehicle run-off-road crashes • Sealed shoulders • Crashes with utility poles on a bend • Removal of poles, or making them frangible • Alternatively crashes may be stored by road user, to identify the crashes involving those users are occurring • Crashes involving • elderly pedestrians • Child pedestrians • Pedal cyclists • Heavy trucks
Collision diagram • The fundamental tool used n site-specific crash diagnosis is the collision diagram • A collision diagram is a schematic representation of all crashes occurring at a given location over a specific period, typically 1-5 years • A collision diagram summarizes the crash history of the site by superimposing on a plan all of the reported crashes at the site being investigated
Collision diagram (continued) • Each collision at the site is represented by a set of arrows, one for each vehicle or pedestrian involved, which indicates the type of the crash and direction of travel • “The exact spot of the crash need not be shown precisely, but it is important to show the direction of conflicting vehicles and pedestrians”
Collision diagram (continued) • e. g. if the dominant crash type at an intersection involves a collision between a through vehicle and a turning vehicle, it is important to know which leg of intersection the turning vehicle approaching from, as this may indicate a visibility problem or an intersection configuration which makes it difficult for drivers to judge gaps in the oncoming traffic
Site investigations • While original crash reports may contain some road and site data, “it will inevitably necessary to carry out a site inspection” to accurately assess the road conditions and other relevant factors in the site Road Features • On-site investigation should attempt to identify adverse features of road design and road traffic environment • Night time investigation • Investigation under adverse weather conditions
Site investigations (continued) • Investigator should walk around the site, and drive through it executing the specific maneuvers which have been shown to be problematic • Particular attention should be given if various topographical features such as the sky, color of the building, foliage or road alignment may combine to create confusion in the mind of drivers • Photograph of the site, its problem areas and its approaches can be a valuable tool in crash investigation
Site investigations (continued) • Video-recording of the site may be appropriate to analyze road user behavior, and perhaps to form a basis of before-and-after study Traffic data • Helpful data • Traffic volumes including turning volumes • Pedestrian flows • Vehicle speed In some cases these data will be available, but in other cases may need to be collected as a special case
Site investigations (continued) • In almost all road crashes, there are human factors derived • Physical and mental condition • Experience and age of the drivers • In most cases human factors will be reflected in the data reports • In some cases, it may be helpful to have additional information on driver behavior at the site • Breaking on entry to a sharp curve • Strange action at an intersection • Inadequate or misleading visual information
Problem analysis • Based on the information from crash summary report, the site visit and perhaps using supplementary data sources, the nature of the crash situation at the site can be investigated • The following question are relevant based on crash investigation • Do crashes associated with the physical condition of the road and can this situation be eliminated or corrected? • Is visibility adequate and can this be corrected? • Are the existing signs and pavement markings do the job? Are replacement needed?
Problem analysis (continued) • Would crashes be prevented if certain movements prohibited? • Can some traffic be diverted to other routes where the crash potential is not as great? • Do condition show the need for additional traffic law enforcement? • Are night time crashes out of proportion to day time crashes, indicating the need for special night time protection such as lighting and delineation? • Is traffic properly minimize the occurrence of conflicts