Download
1 / 28
280 likes | 440 Views
Unit 2: Graphs and Inverses of Trigonometric Functions. LG 2-1 Graphing Trigonometric Functions Test 9/4 LG 2-2 Applications of Trig Functions Test 9/9 LG 2-3 Evaluating Inverse Trig Functions LG 2-4 Graphing Inverse Trig Functions Test 9/13.

E N D
Unit 2: Graphs and Inverses of Trigonometric Functions LG 2-1 Graphing Trigonometric Functions Test 9/4 LG 2-2 Applications of Trig Functions Test 9/9 LG 2-3 Evaluating Inverse Trig Functions LG 2-4 Graphing Inverse Trig Functions Test 9/13
So far, in our study of trigonometric functions we have: defined all of them learned how to evaluate them used them on the unit circleSo logically, the next step would be to study the graphs of the functions.
What’s Your Temperature? Scientists are continually monitoring the average temperatures across the globe to determine if Earth is experiencing Climate Change (Global Warming!). One statistic scientists use to describe the climate of an area is average temperature. The average temperature of a region is the mean of its average high and low temperatures.
What’s Your Temperature? A function that repeats itself in regular intervals, or periods, is called periodic. a. If you were to continue the temperature graph, what would you consider its interval, or period, to be? b. Choose either the high or low average temperatures and sketch the graph for three intervals, or periods.
Periodicity is Common in Nature • Day/night cycle (rotation of earth) • Ocean Tides • Pendulums and other swinging movements • Ocean waves • Birth/marriage/death cycle • Menstrual cycle • Eating and sleeping cycle • Musical rhythm • Linguistic rhythm • Dribbling, juggling • Calendars • Fashion cycles, for example, skirt lengths or necktie widths • Economic and political cycles, for example, boom and bust economic periods, right-wing and left-wing political tendencies
Periodic Functions • Aperiodic functionis a function whose values repeat at regular intervals. • The part of the graph from any point to the point where the graph starts repeating itself is called a cycle. • The period is the difference between the horizontal coordinates corresponding to one cycle. • Sine and Cosine functions complete a cycle every 360°. So the period of these functions is 360°.
Graphing Trig Functions Whenever you have to draw a graph of an unfamiliar function, you do it by point-wise plotting (calculating and plotting enough points to detect a pattern). Then you connect the points with a smooth curve or line. Objective: Discover by point-wise plotting what the graphs of all 6 trig functions looks like. .
Graphing Calculator Introduction • Make sure that your calculator is in the correct mode (degrees or radians). • Graph y = sin Θin y1 & look on the Ztrig window (zoom + 7). Trace along the graph. What do you observe? • Repeat for all trig functions (one at a time)
Graphing Trig Functions • The graphs of the trig functions are made by evaluating each function at the special angles on the unit circle. • The input of the function is the angle measure on the unit circle. • The output is the value of the function for that angle. • We can “unwrap” these values from the unit circle and put them on the coordinate plane.
Vocabulary • Sinusoid – a graph of a sine or cosine function • Sinusoidal axis - the horizontal line halfway between the local maximum and local minimum: y = 0 for parent function • Convex – bulging side of the wave • Concave – hollowed out side of the wave • Concave up • Concave down • Point of inflection - point on a curve at which the sign of the curvature (the concavity) changes.
Co-Trig (Reciprocal) Functions • Each of the reciprocal trig functions relate to the original graph. • Plot the “important points” for the sine function on the cosecant graph and then sketch the sine curve LIGHTLY – not in pen!!!
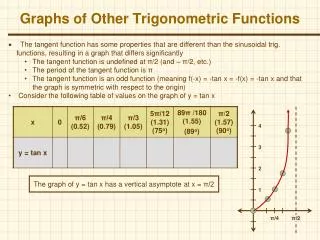
Discontinuous Functions • The graphs of tan, cot, sec, and csc functions are discontinuous where the function value would involve division by zero. What happens to the graph when a function is discontinuous?
Trig Function Characteristics • As always, we need to talk about domain, range, max and min, etc. • You will fill out the table for each of the 6 trig functions (and finish for HW).
Period • The period of a trig function is how long it takes to complete one cycle. • What is the period of sine and cosine? • What about cosecant and secant? • Tangent and cotangent? • The period of the functions tangent and cotangent is only 180° instead of 360°, like the four trigonometric functions.
Domain and Range • When we think about the domain and range, we have to make sure we are considering the entire function and not just the part on the unit circle.
Maximum and Minimum • Local max & min • Absolute max & min
Intercepts • x-intercepts • y-intercepts
Points of Inflection • point on a curve at which the sign of the curvature (the concavity) changes. • Will all graphs have points of inflection?
Intervals of Increase and Decrease • Positive slope? • Negative slope?
What’s Your Temperature? Sine and Cosine functions can be used to model average temperatures for cities. Based on what you learned about these graphs, why do you think these functions are more appropriate than a cubic function? Or an exponential function?