Download
1 / 15
150 likes | 246 Views
Moisture in the Air and Forecasting Weather Quizzes. Take out a piece of notebook paper and number from 10 – 23 Hand in core bin when done. 10. The relative humidity in cube “B” is a. Lower than cube “A” b. Higher than cube “A” c. The same as cube “A”.

E N D
Moisture in the Air and Forecasting Weather Quizzes Take out a piece of notebook paper and number from 10 – 23 Hand in core bin when done.
10. The relative humidity in cube “B” is • a. Lower than cube “A” • b. Higher than cube “A” • c. The same as cube “A”
11. Cube “A” is 15° warmer than cube “B”. Which cube shows air with lower relative humidity than the other cube? • a. Cube “A” • b. Cube “B”
12. Which image shows conditions for higher humidity? • a. Image “A” • b. Image “B”
13. What is the highest relative humidity for the day? • a. 92.2% • b. 79.2% • c. 84.5%
14. At what time did the highest Relative Humidity occur? • a. 7:00 AM • b. 8:00 AM • c. 9:00 AM
15. Select the letter on the illustration that shows water droplets falling from the clouds. • a. A • b. B • c. C
16. At what time did the lowest Relative Humidity occur? • a. 12:00 PM • b. 2:00 PM • c. 4:00 PM
17. Choose the most correct statement based upon your data above. • a. As relative humidity decreases, temperature decreases. • b. As temperature increases, relative humidity increases. • c. As relative humidity increase, temperature increases. • d. As temperature increases, relative humidity decreases.
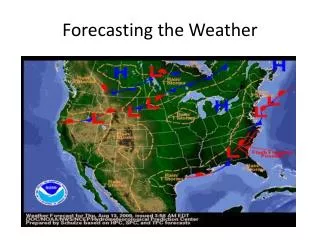
18. To predict areas of possible storm development, select a tool you would use to gather the necessary data. • a. Dew point map • b. Visible satellite • c. Infrared map
19. You and your friends are going to an outdoor sporting event in 3 days and want to know what the weather will be like on that day. Which tool or method would you use? • a. Temperature map • b. Computer model • c. Trends method
20. Which is the best map to collect data for determining areas of fog and/or snow? • a. Left image • b. Center image • c. Right image
21. Observe the changes in temperature for the entire country. Select a state or two states together where you would expect that a front is occurring. • a. Maine and New Hampshire • b. Kansas and Nebraska • c. Nevada and California
22. Given the variables above, predict the weather. • a. Storms are likely • b. Temperatures will drop • c. No change is likely
23. Select the data provided when using the map above: • a. Water vapor in air • b. Cloud cover • c. Observation of conditions right now