Download
1 / 23
240 likes | 372 Views
Characterization and Suppression of Wind Noise Using a Large-Scale Infrasound Sensor Array. Carrick L. Talmadge Doug Shields Kenneth E. Gilbert The University of Mississippi, Oxford, MS USA. Infrasound Detection. propagation. source. receiver.

E N D
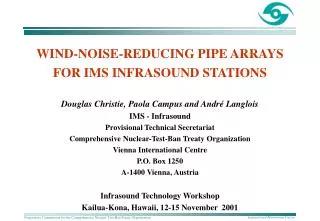
Characterization and Suppression of Wind Noise Using a Large-Scale Infrasound Sensor Array Carrick L. Talmadge Doug Shields Kenneth E. Gilbert The University of Mississippi, Oxford, MS USA
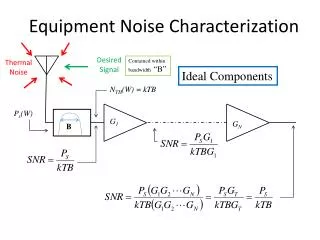
Infrasound Detection propagation source receiver • Effects of vertical variation in wind-velocity and temperature profiles; including diurnal effects • Effects of turbulent scattering • Terrain effects • Must consider effects of: • wind-generated sound • atmospheric turbulence (intrinsic pressure fluctuations) • pressure probe body on pressure measurements • Source characterization (wave form, signal level, directionality, etc.);. Robust system design needs data-driven models of all three components!
Advantages of Sensor Arrays • Arrays provide • directionality (source location); • noise reduction using more sophisticated DSP algorithms; • the ability to separately characterize the signal and the noise.
A/D Signal Processing Old Array Technology D N Sensors Total Cable Required N2D/4 Example: N = 40 D = 5m L = 200m Total Cable = 2000m
D A/D A/D A/D A/D A/D A/D Signal Processing P P P P P P New Array Technology N Sensors Total Cable Required ND Example: N = 40 D = 5m L = 200m Total Cable = 200m
Smart Sensor Arrays • Components of smart sensor element: • Ruggedized sensor and sensor body • Signal conditioning with programmable gain and anti-alias filter • Analog-to-digital stage with programmable sampling rate • Microcontroller-based networking using RS-485 standard (~ 2Mbps data rate). • Remotely controlled self-calibration and diagnostic testing of individual sensors. • Approximate delivery dates for bimorph sensors: • 8 prototypes January 1, 2002 • 100 manufactured units March 1, 2002.
Second-Generation Array wireless link sub arrays central processor DSP-based“collector” units with RS-485 to wireless modem RS-485 networked sensor elements
Bimorph Capsules • Resonant Frequency - 3 kHz • Sensitivity - 1 to 4 mV/Pa • Temperature Compensation • Reverse bimorphs • Insulated enclosures, small openings • Charge Generating • Must operate into a high impendence
Acoustic Sensor Development Gabrielson Piezo-Resistive Transducer Move first-stage amplifier onto sensor board (small-outline IC). • Features: • 0.005 - 1000 Hz • High Sensitivity (20 mV/Pa) • Low Power Usage • Low Cost (Less than $250 per unit) 9V Batteries Add anti-alias filter and 24-bit sigma-delta A/D converter. Replace acrylic back volume with insulated brass back volume instrumented for internal temperature.
Oxford Airport Array Experiment Chris Clark, Ken Gilbert, Doug Shields, Carrick Talmadge, Ron Wagstaff Chad Williams, Jay Williams, Zak Williams Experiment took place on April 6, 2001 40 minutes of data were collected over an ~ 1 hr interval 2 microphone arrays, sonic anemometer Levels calibrated using a B&K sound meter (not to scale)
Experimental Setup anemometer bimorph array (11x) B&K array (6x) south
Single Sensor (B&K) Results Run #1 (50-Hz tone) — initial 10 seconds of recording Successive sensor outputs have been shifted by –10Pa. Sensor #
Amplitude and Phase Shown is the amplitude and phase for the 50-Hz tone from the sensor 1 read-out. The propeller-driven plane which lands around 150 seconds had no noticeable influence on the 50-Hz tone… “pops” Run 1: 50-Hz tone “Prop” plane landing (CPA) Run 1: 50-Hz tone
Run 1: 50-Hz Tone Time Series Spectrum (Fourier Transform) Signal Amplitude Time [sec] Frequency [Hz] Pressure [Pa] RMS Averaged Spectrum Frequency [Hz]
Run 1: 50-Hz Tone median RMS 40-Hz bin 40-Hz bin 50-Hz bin Level [dB SPL] Count 50-Hz bin 60-Hz bin 60-Hz bin Time [sec] Level [dB SPL]
Run 1: 50-Hz tone Note that “pops” in playback create erroneous spectra using RMS spectrogram. Median spectrogram is more robust and will be used here throughout. Calibration of B&K sensors is excellent between 10-250 Hz (error is on the order of 1 dB). (RMS) median
Run 6: 25-50 Hz Tones, 5-Hz Steps wind-generated sound
30 6.46 m 15 16 Yocona River Array Experiment Sewage Disposal Plant Yocona River Hwy 7 0.8 mile Observation Station Sound Source Prevailing Wind Observation Station 350 meters N 1
N 1 3 30 6.46 m 15 16 Prevailing Wind 0 2 4 6 8
Wind Noise Correlation Strength vs. Distance Maximum Correlation Separation [m] Separation [m] Correlation Parallel to Wind Direction Correlation Transverse to Wind Direction
Conclusions • Large-scale microphone arrays are a versatile, transportable alternative to pipe arrays. • In general, they provide superior wind-noise reduction due to the more sophisticated DSP algorithms which are possible. • The three components of wind noise (intrinsic pressure fluctuations; wind-generated sound; probe-body induced pressure fluctuations) can be decoupled and separately characterized.