Download
1 / 10
100 likes | 147 Views
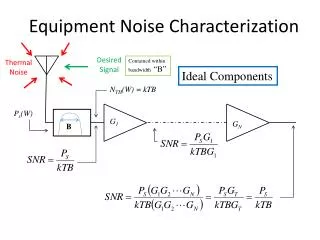
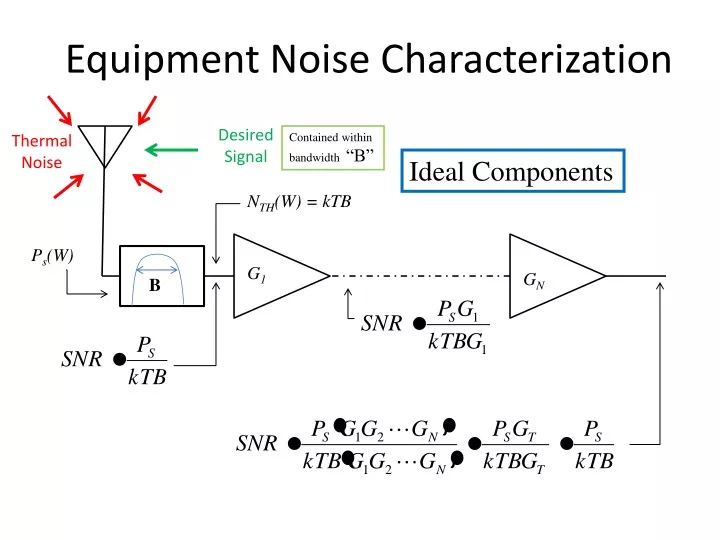
Desired Signal. Thermal Noise. Contained within bandwidth “B”. Ideal Components. Equipment Noise Characterization. N TH (W) = kTB. P s (W). G 1. G N. B. Noise Ratio. P S1 (mW) + N TH (mW). G 1. G 1 (P S1 (mW) + N TH (mW) + N 1 (mW)). + +. N 1 (mW). Definition:

E N D
Desired Signal Thermal Noise Contained within bandwidth “B” Ideal Components Equipment Noise Characterization NTH(W) = kTB Ps(W) G1 GN B
Noise Ratio PS1(mW) + NTH(mW) G1 G1(PS1(mW) + NTH(mW) + N1(mW)) + + N1(mW) Definition: A measure of how much a system degrades SNR. If NR is given, then we can compute Ratio of noise added to thermal noise (KT0B) T0is ALWAYS 290 K for Noise Ratio Computations
Practical Components Noise spectral density out of any device can never be less than kT. Desired Signal Thermal Noise Equipment Noise Characterization NTH(dBm) = 10 log10(kT0B) + 30 dB Because kTB is in Watts! PS0(dBm) L1(dB) G1 B + + Shot noise contribution of first amp. We model the noise contribution as being added at the amp input, and amplified by the amp’s gain. N1(dBm) Since noise power is being added, we must use mW, NOT dBm.
Cascade Noise Ratio G1 , NR1 G2 , NR2 + + + + N1 N2 G1(PS1 + kT0B+ N1) G2(G1(PS1 + kT0B + N1)+N2) Which can be Generalized to N Stages: Friis’ Formula
Noise Ratio with Preceding Insertion Loss L1(dB) G1 , NR1 B + + N1(dBm) G1(a1 PS1 + kT0B + N1) a1PS1 + kT0B Since the effects of preceding loss are multiplicative w.r.t. both noise ratio and gain, it makes sense to deal with losses using dB units . . .
Noise Figure (dB) Noise Figure, NF(dB), is Noise Ratio expressed in dB: Noise characteristics for devices are usually published/specified by Noise Figure (dB). When a device with specified Gain and Noise Figure (GI , NFI; both in dB) is preceded by one or more passive devices with specified total insertion loss (LI in dB), they can be combined into a single stage having GC(dB) = GI(dB) – LI(dB) and NFC(dB) = NFI(dB) + LI(dB) GI , NFI GC , NFC LI
System Noise Figure The overall noise figure for a system containing both active gain stages and passive loss stages is computed as follows: • Combine all passive losses with their succeeding gain stages using • GC,I (dB) = GI(dB) – LI (dB) and NFC,I(dB) = NFI(dB) + LI (dB) • 2. The sum of the resulting combined gains (in dB) is total system gain, GSYS(dB) • Convert all combined gains and noise figures to their ratio metric (non-dB) values • Apply Friis’ formula using the resulting combined Gains and Noise Ratios to obtain overall Noise Ratio for the system. • Convert overall Noise Ratio back into dB’s : NFSYS(dB)
System Noise Temperature Concepts of Noise Figure and Noise Ratio were developed when virtually all communications system were terrestrially based, hence the implicit use of T0 = 290 K (the mean blackbody temperature of the earth). No one ever aimed an antenna up at the sky and expected to receive anything meaningful. With the advent of space communication and radio astronomy, an equivalent concept of noise temperature was developed which seemed to make more sense in that context: If we subtract one from each side of Friis’ formula and then multiply both sides by T0, we have: Substituting the definition of equivalent noise temperature from above,
Discussion Consider Friis’ Formula: The Noise Ratio contributions of all but the first stage are reduced by the gains of preceding stages. The gain of the first stage should be high, to reduce the contributions of succeeding stages. The Noise Ratio of the first stage should be as low as possible, since it contributes directly to the system noise ratio. Any passive losses prior to the first gain stage should be minimized, as it detracts from 1 and 2 above.
Example G1 = 15 dB NF1 = 6 dB G2 = 10 dB NF2 = 12 dB G3 = 25 dB NF3 = 16 dB G4 = 18 dB NF4 = 12 dB L1 = 2 dB L2 = 5 dB G2 = 10 dB NF2 = 12 dB G3 = 20 dB NF3 = 21 dB G4 = 18 dB NF4 = 12 dB G1 = 13 dB NF1 = 8 dB G2 = 10 NR2 = 16 G3 = 100 NR3 = 128 G4 = 64 NR4 = 16 G1 = 20 NR1 = 6.4 Step 2: Convert Gains and Noise Figures ratio-metric Forms Step 3: Combine Gains and Noise Ratios Using Friis’ Formula Step 4: Convert overall Gain and Noise Ratio Back to dB Step 1: Combine all passive losses with succeeding gain stages.