Download
1 / 15
150 likes | 286 Views
Building and Analyzing Genome-Wide Gene Disruption Networks. J. Rung, T. Schlitt, et al. (2002) Presented by Sean Whalen , 2/26/03. Outline. What is a gene network What is a disruption network Building the network Observations Degree distribution Connectivity Review Conclusions.

E N D
Building and Analyzing Genome-Wide Gene Disruption Networks J. Rung, T. Schlitt, et al. (2002) Presented by Sean Whalen, 2/26/03
Outline • What is a gene network • What is a disruption network • Building the network • Observations • Degree distribution • Connectivity • Review • Conclusions
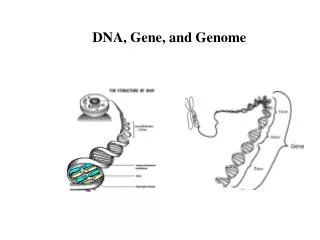
What is a gene network? • Directed Acyclic Graph (DAG) • Nodes/Vertices=Objects, Edges/Arcs=Relationships • Arbitrary meaning is assigned, in order to visualize relationships in a system (and acquire knowledge) • Gene networks simply model genetic relationships
More on Gene Networks • How to represent the network? Arbitrary. • Example: Edge between nodes means parent codes for transcription factor • Example: Edge between nodes means change in expression level of parent affects level of child • Different modeling methods • Bayesian, Dynamic Bayesian • Problem: only deals with small data sets • This paper’s method: simple, genome-wide analysis, demonstrated biologically meaningful (yeast)
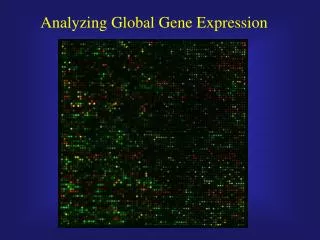
What is a disruption network? • Gene network built from expression data (mutant strain vs. control) • Nodes are genes, edges indicated a causal change in expression level • Represented as a matrix • A discretized matrix is built from this matrix, to infer connectivity properties • Disruption network=graph representation of discretized matrix
Building the Network • Expression data matrix • rij = log( lij / cij ) • rij = jth element of ith row • l = exp. level in mutant • c = exp. level in control • Discretized matrix • Expression level up, down, or unchanged • Normalize rij, adjust for gene-specific standard deviation • Select cutoff level γ [2..4] • Expression matrix → Normalize → Select Cutoff → Discrete Matrix
Building the Network (cont.) • Disruption network γ' is representation of discretized network as a graph • Edge between gi and gj if dij ≠ 0 • Label edge as down regulating if dij=-1, up regulating if dij=1. Nodes labeled w/gene names • Expression data from all genes in a yeast mutant (single gene deletion) taken over 300 experiments w/63 control experiments
up C A up down B Matrix → Graph Example
Observations • High out degree = influence many other genes • High in degree = complex regulation • Distribution of total degree follows power law (scale-free topology) • 50% of genes show change in expression with single deletion • Few genes with high in AND out degree • Strongy connected subnets (hubs) are evolutionally more conserved
Out Degree vs. In Degree The point? Rare for node to have high ranked in degree AND out degree. Only 1 node’s in degree is in the top 50% of in degrees, AND out degree is in top 50% of out degrees.
Connectivity • How connected is the graph with different γ values? • γ<3, one big component • Remove top 1%, 5%, and 10% of highest degree genes • For 3<γ<3.6, biggest component still order of magnitude higher
Review • A disruption networks is a graph representation of a discretized expression matrix, with a degree cutoff γ • Allows genome-wide analysis • Power-law distribution of edges • High out degree=gene encodes regulatory proteins • High in degree=gene involved in metabolism
Conclusions • Disruption networks suggest scale free topology in gene regulatory networks • Dominated by single large component (hub) • Looking for subnets containing genes involved in a process allowed prediction of genes with similar functions • DNs offer a different perspective of expression data than tradition methods such as heirarchical clustering