Download
1 / 37
370 likes | 509 Views
Perception. CS533C Presentation by Alex Gukov. Papers Covered. Current approaches to change blindness Daniel J. Simons. Visual Cognition 7, 1/2/3 (2000) Internal vs. External Information in Visual Perception Ronald A. Rensink. Proc. 2nd Int. Symposium on Smart Graphics, pp 63-70, 2002

E N D
Perception CS533C Presentation by Alex Gukov
Papers Covered • Current approaches to change blindness Daniel J. Simons. Visual Cognition 7, 1/2/3 (2000) • Internal vs. External Information in Visual Perception Ronald A. Rensink. Proc. 2nd Int. Symposium on Smart Graphics, pp 63-70, 2002 • Visualizing Data with Motion Daniel E. Huber and Christopher G. Healey. Proc. IEEE Visualization 2005, pp. 527-534. • Stevens Dot Patterns for 2D Flow Visualization. Laura G. Tateosian, Brent M. Dennis, and Christopher G. Healey. Proc. Applied Perception in Graphics and Visualization (APGV) 2006
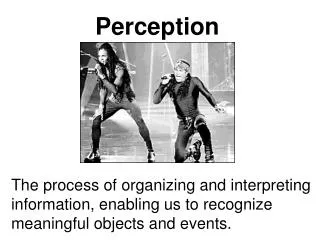
Change Blindness • Failure to detect scene changes
Change Blindness • Large and small scene changes • Peripheral objects • Low interest objects • Attentional blink • Head or eye movement – saccade • Image flicker • Obstruction • Movie cut • Inattentional blindness • Object fade in / fade out
Mental Scene Representation How do we store scene details ? • Visual buffer • Store the entire image • Limited space • Refresh process unclear • Virtual model + external lookup • Store semantic representation • Access scene for details • Details may change • Both models support change blindness
Overwriting • Single visual buffer • Continuously updated • Comparisons limited to semantic information • Widely accepted
First Impression • Create initial model of the scene • No need to update until gist changes • Evidence • Test subjects often describe the initial scene. Actor substitution experiment.
Nothing is stored( just-in-time) • Scene indexed for later access • Maintain only high level information ( gist ) • Use vision to re-acquire details • Evidence • Most tasks operate on a single object. Attention constantly switched.
Nothing is compared • Store all details • Multiple views of the same scene possible • Need a ‘reminder’ to check for contradictions • Evidence • Subjects recalled change details after being notified of the change. Basketball experiment.
Feature combination • Continuously update visual representation • Both views contribute to details • Evidence • Eyewitness adds details after being informed of them.
Coherence Theory • Extends ‘just-in-time’ model • Balances external and internal scene representations • Targets parallelism, low storage
Pre-processing • Process image data • Edges, directions, shapes • Generate proto-objects • Fast parallel processing • Detailed entities • Link to visual position • No temporal reference • Constantly updating
Upper-level Subsystems • Setting (pre-attentive) • Non-volatile scene layout, gist • Assists coordination • Directs attention • Coherent objects (attentional) • Create a persistent representation when focused on an object • Link to multiple proto-objects • Maintain task-specific details • Small number reduces cognitive load
Subsystem Interaction Need to construct coherent objects on demand • Use non-volatile layout to direct attention
Coherence Theory and Change Blindness • Changes in current coherent objects • Detectable without rebuilding • Attentional blink • Representation is lost and rebuilt • Gradual change • Initial representation never existed
Implications for Interfaces • Object representations limited to current task • Focused activity • Increased LOD at points of attention • Predict or influence attention target • Flicker • Pointers, highlights.. • Predict required LOD • Expected mental model • Visual transitions • Avoid sharp transitions due to rebuild costs • Mindsight ( pre-attentive change detection)
Critique • Extremely important phenomenon • Will help understand fundamental perception mechanisms • Theories lack convincing evidence • Experiments do not address a specific goal • Experiment results can be interpreted in favour of a specific theory (Basketball case)
Visualizing Data with Motion • Multidimensional data sets more common • Common visualization cues • Color • Texture • Position • Shape • Cues available from motion • Flicker • Direction • Speed
Previous Work • Detection • 2-5% frequency difference from background • 1o/s speed difference from the background • 20o direction difference from the background • Peripheral objects need greater separation • Grouping • Oscillation pattern – must be in phase • Notification • Motion encoding superior to color, shape change
Flicker Experiment • Test detection against background flicker • Coherency • In phase / out of phase with the background • Cycle difference • Cycle length
Flicker Experiment - Results • Coherency • Out of phase trials detection error ~50% • Exception for short cycles - 120ms • Appeared in phase • Cycle difference, cycle length (coherent trials) • High detection results for all values
Direction Experiment • Test detection against background motion • Absolute direction • Direction difference
Direction Experiment - Results • Absolute direction • Does not affect detection • Direction difference • 15o minimum for low error rate and detection time • Further difference has little effect
Speed Experiment • Test detection against background motion • Absolute speed • Speed difference
Speed Experiment - Results • Absolute speed • Does not affect detection • Speed difference • 0.42o/s minimum for low error rate and detection time • Further difference has little effect
Applications • Can be used to visualize flow fields • Original data 2D slices of 3D particle positions over time (x,y,t) • Animate keyframes
Critique • Study • Grid density may affect results • Multiple target directions • Technique • Temporal change increases cognitive load • Color may be hard to track over time • Difficult to focus on details
Idea • Initial Setup • Start with a regular dot pattern • Apply global transformation • Superimpose two patterns • Glass • Resulting pattern identifies the global transform • Stevens • Individual dot pairs create perception of local direction • Multiple transforms can be detected
Stevens Model • Predict perceived direction for a neighbourhood of dots • Enumerate line segments in a small neighbourhood • Calculate segment directions • Penalize long segments • Select the most common direction • Repeat for all neighbourhoods
Stevens Model Segment weight
Stevens Model • Ideal neighbourhood – empirical results • 6-7 dots per neighbourhood • Density 0.0085 dots / pixel • Neighbourhood radius • 16.19 pixels • Implications for visualization algorithm • Multiple zoom levels required
2D Flow Visualization • Stevens model estimates perceived direction • How can we use it to visualize flow fields ? • Construct a dot neighbourhoods such that the desired direction matches what is perceived
Algorithm • Data • 2D slices of 3D particle positions over a period of time • Algorithm • Start with a regular grid • Calculate direction error around a single point • Desired direction: keyframe data • Perceived direction: Stevens model • Move one of the neighbourhood points to decrease error • Repeat for all neighbourhoods
Critique • Model • Shouldn’t we penalize segments which are too short ? • Algorithm • Encodes time dimension without involving cognitive processing • Unexplained data clustering as a visual artifact • More severe if starting with a random field