Download
1 / 9
90 likes | 139 Views
To what extent are graphs helpful to interpret reality. Graphs, can we trust them?. TOK.

E N D
To what extent are graphs helpful to interpret reality Graphs, can we trust them? TOK
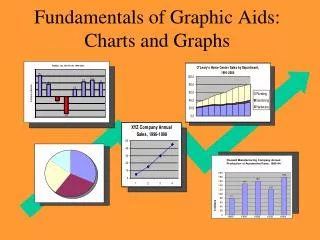
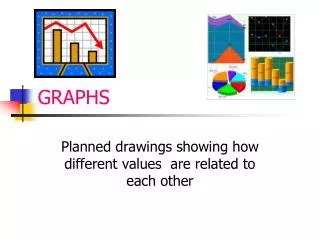
Graphing is a very convenient technique to represent data in a manner which can easily be understood. We found out that understanding graphs is easier to interpret than processed data. It is a very convenient way of finding various possibilities and calculating/estimating values.
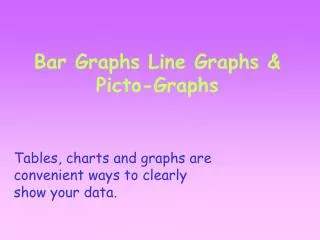
What we believe is that the data in value table might confuse many people and many might find it boring to see the values in the table but if the same data is represented graphically it is comparatively easy to interpret the data at a glance.
The above pie chart/ graph shows how a student would be able to allocate his financial resources. Understanding this is much easier than raw data.
Limitations of graphing. Graphing can lead to misinterpretation in many cases. An example of this has been shown below.
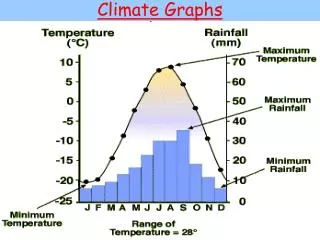
At first glance the bottom graph does seem to contradict the top graph. However, looking more closely you realize that the two graphs actually represent completely different data sets. The top graph is a representation of change in annual mean global temperature normalized to a 30-year period, 1960-1990, whereas the bottom graph represents average temperatures in Europe compared to an average over the 20th-century. So a wrong interpretation of graphs can lead to a misleading result.
A chart should include all the data. Excluding some data can result in a misleading graph. However, in a graph showing changes over period of time, the preparer of the graph has to chose how long a period is relavent. If we are explaining global warming, a plot showing 100 years might be good. But a graph of car accidents per year, perhaps 5 years is more reasonable.
Imaginary numbers cannot be expressed in graphs. Uncertainty in a value is something which cannot be easily ignored as it is the value by which your answer may vary. Error bars (uncertainty) can be expressed in graphs which can help us see the magnitude of our mistakes.