Download
1 / 15
150 likes | 417 Views
Bar Graphs Line Graphs & Picto-Graphs. Tables, charts and graphs are convenient ways to clearly show your data.

E N D
Bar Graphs Line Graphs & Picto-Graphs Tables, charts and graphs are convenient ways to clearly show your data.
The cafeteria wanted to collect data on how much milk was sold in 1 week. The table below shows the results. We are going to take this data and display it in 3 different types of graphs.
Scale / Intervals • Counting by a number is the scale of a graph. Scales can be counting by 2’s, 3’s,4’s, 5’s 10’s … • Intervals should be equal. Like 100, 200, 300 units.
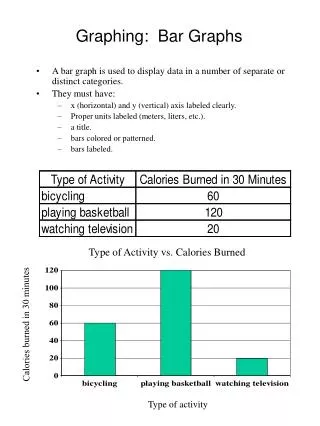
Bar Graph • A bar graph is used to show relationships between groups. • The two items being compared do not need to affect each other. • It's a fast way to show big differences. Notice how easy it is to read a bar graph.
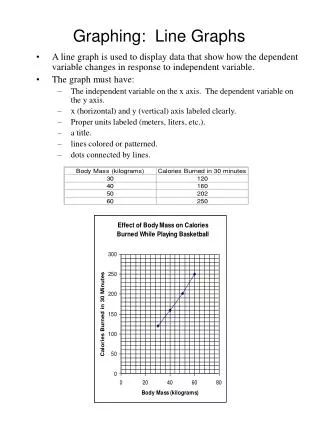
Line Graph • A line graph is used to show continuing data; how one thing is affected by another. • It's clear to see how things are going by the rises and falls a line graph shows.
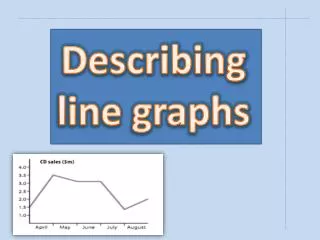
On what day did they sell the most chocolate milk? Wednesday
On what day did they have a drop in chocolate milk sales? Thursday
Choosing the Right Graph • Use a bar graph if you are not looking for trends (or patterns) over time; and the items (or categories) are not parts of a whole. • Use a line graph if you need to see how a quantity has changed over time. Line graphs enable us to find trends (or patterns) over time.
Pictograph Days of the Week Fireflies
Pictograph • All pictographs have a title. • Rows and columns shape the pictograph. • Label each row and column. • Use pictures to show the data. • Each picture equals a certain amount of data. • Pictographs need a key.
Bar Graph • The purpose of a bar graph is to display and compare data. • Bar graphs use bars to show the data. • A bar graph must include: - a title - labeled X and Y axes - equal intervals are used on the Y axis - the bars are evenly spaced apart from each other
Line Graph • A line graph is used to illustrate change over time. • Line graphs need: - Title - Labeled X and Y axes - Equal Intervals - Data displayed by points connected into lines
Bar Graphs Line Graphs & Picto-Graphs Tables, charts and graphs are convenient ways to clearly show your data.