Download
1 / 19
190 likes | 394 Views
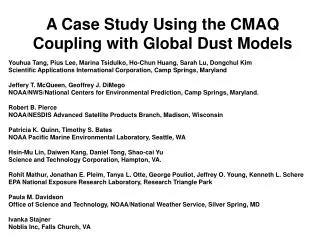
A Case Study Using the CMAQ Coupling with Global Dust Models. Youhua Tang, Pius Lee, Marina Tsidulko, Ho-Chun Huang, Sarah Lu, Dongchul Kim Scientific Applications International Corporation, Camp Springs, Maryland Jeffery T. McQueen, Geoffrey J. DiMego

E N D
A Case Study Using the CMAQ Coupling with Global Dust Models Youhua Tang, Pius Lee, Marina Tsidulko, Ho-Chun Huang, Sarah Lu, Dongchul Kim Scientific Applications International Corporation, Camp Springs, Maryland Jeffery T. McQueen, Geoffrey J. DiMego NOAA/NWS/National Centers for Environmental Prediction, Camp Springs, Maryland. Robert B. Pierce NOAA/NESDIS Advanced Satellite Products Branch, Madison, Wisconsin Patricia K. Quinn, Timothy S. Bates NOAA Pacific Marine Environmental Laboratory, Seattle, WA Hsin-Mu Lin, Daiwen Kang, Daniel Tong, Shao-cai Yu Science and Technology Corporation, Hampton, VA. Rohit Mathur, Jonathan E. Pleim, Tanya L. Otte, George Pouliot, Jeffrey O. Young, Kenneth L. Schere EPA National Exposure Research Laboratory, Research Triangle Park Paula M. Davidson Office of Science and Technology, NOAA/National Weather Service, Silver Spring, MD Ivanka Stajner Noblis Inc, Falls Church, VA
Objective • Current operational WRF-NMM/CMAQ forecast still uses static profile lateral boundary condition (LBC). Our testing shows dynamic ozone LBCs from global models have significant impact on air quality prediction in upper and middle troposphere. What is the impact on particulate matter prediction? • During Texas Air Quality Study 2006, the model inter-comparison team found all 7 regional air quality models missed some high-PM events that can not be reasonably interpreted with any local or regional factors. Here we revisit these events by coupling a regional model with global models.
WRF-NMM/CMAQ Model Configuration • Driven by hourly meteorological forecasts from the operational North America Mesoscale (NAM) WRF-NMM prediction system. • The operational CMAQ system covering Continental USA in 12km horizontal resolution Carbon Bond Mechanism-4 (CBM4) with AERO3 22 vertical layers up to 100hPa. vertical diffusivity and dry deposition based on Pleim and Xu (2001), scale J-table for photolysis attenuation due to cloud Asymmeric Convective Scheme (ACM) (Pleim and Chang, 1992).
GOCART has 5 dust bins in diameter: • 0.2-2 μm, 2-4 μm, 4-6 μm, 6-12 μm, 12-18 μm • Which are mapped into CMAQ with • PM2.5=bin1+0.4187*bin2 • PM_Coarse=0.5813*bin2+bin3+0.7685*bin4
GFS-GOCART prediction for a dust intrusion event around Aug 2, 2006
Surface weather map on July 28, 2006 Dust Intrusion Path
GFS-GOCART and RAQMS exhibit differences in altitude and concentration of dust along the eastern lateral boundary of CMAQ that causes differences in PM prediction over Texas
GFS-GOCART LBC Dust Intrusion Path RAQMS LBC
GFS-GOCART LBC RAQMS LBC CMAQ surface PM2.5 (μg/m3) Compared to AIRNOW at 18Z, 08/02/2006
The NOAA ship Ron Brown measurements also showed the dust signal in marine boundary layer. Julian day 212 is July 31 Ron Brown dust mass is calculated as [Dust] = 2.2[Al] + 2.5[Si] + 1.63[Ca] + 2.2[Fe] + 1.9[Ti] This equation includes a 16% correction factor to account for the presence of oxides of other elements such as K, Na, Mn, Mg, and V. Also, the equation omits K from biomass burning by using Fe as a surrogate for soil K and an average K/Fe ratio of 0.6 in soil. (Malm et al., JGR, 99, 1347, 1994)
Another method to use GFS-GOCART output: CMAQ base + GOCART DUST PM2.5 (Bin1+0.4187Bin2)
Aug 17 Aug 18 Aug 19 Aug 20 Aug 21 Aug 25 Aug 22 5 km Aug 28 3 km Aug 23 CALIPSO images provided by Dave Winker
GFS-GOCART prediction for another dust intrusion event around Aug 28, 2006
Another intrusion event around Aug 28 CMAQ predictions compared to Ron Brown data
Model simulations compared to AIRNOW hourly PM2.5 data Period of 20060729 to 20060807 Period of 20060827 to 20060902 Other than the circled cases, the regional predictions coupled with global models show improvement over the CMAQ base prediction. S is regression slope, R is correlation coefficient, and MB is mean bias in μg/m3
Summary • Appropriate LBCs are necessary for successful regional PM prediction during dust intrusion events. For summer 2006 events, dust LBC sometimes dominated the influence on regional PM prediction. • The model results shows that there is strong sensitivity of the surface PM prediction to the entry height of the dust intrusion. (elevated lower troposphere versus near surface) • These coupling experiments mainly reflect the long-range transport impact on certain local receptors. The model prediction can be very sensitive to accuracies of dynamical, physical and chemical processes in both global and regional models.