Download
1 / 16
160 likes | 302 Views
A Comparison of Algorithms for Species Identification based on DNA barcodes. Bogdan Paşaniuc. CSE Department, University of Connecticut. Joint work with Alexander Gusev, Sotirios Kentros, James Lindsay and Ion Măndoiu. Introduction. Several methods proposed for assigning specimens to species

E N D
A Comparison of Algorithms for SpeciesIdentification based on DNA barcodes Bogdan Paşaniuc CSE Department, University of Connecticut Joint work with Alexander Gusev, Sotirios Kentros, James Lindsay and Ion Măndoiu
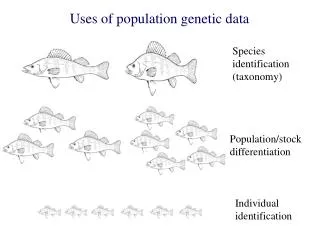
Introduction Several methods proposed for assigning specimens to species TaxI (Steinke et al.05), Likelihood ratio test (Matz&Nielsen06), BOLD-IDS(Ratnasingham&Hebert 07)… No direct comparisons on standardized benchmarks This work: Direct comparison of methods from three main classes Distance-based, tree-based, and statistical model-based Explore the effect of repository size #barcodes/species, #species • Species identification problem • Given repository containing barcodes from known species and a new barcode find its species
Datasets • Fishes of Australia Container Part [Ward et. al, 05] • 754 barcodes, 211 species, 113 genera • Cowries [Meyer and Paulay, 05] • 2036 barcodes, 263 species, 46 genera • Birds of North America - Phase II [Kerr K.C.R. et al, 07] • 2589 barcodes, 656 species, 289 genera • Bats of Guyana [Clare E.L. et al, 06] • 840 barcodes, 96 species, 50 genera • Hesperidia of the ACG 1[Hajibabaei M. et al, 05] • 4267 barcodes, 561 species, 207 genera • 90% in training and 10% in testing
Distance-based methods • Barcode assigned to closest specie • Two-variants: Minimum/Maximum or Average • Hamming distance [MIN-HD, AVG-HD] • Percent of sequence divergencence • Aminoacid Similarity [MAX-AA-SIM, AVG-AA-SIM] • Blossom62 matrix to score similarity • Convex Score similarity [MAX-CS-SIM] • Higher score to longer consecutive runs of matches • Tri-nucleotide frequency distance [MIN-3FREQ] • Euclidian distance between vectors of frequencies • Combined method [COMB] • Assignment made using majority rule
Tree-based methods • Exemplar NJ [Meyer&Paulay05] • One exemplar per species (random) • One neighbor joining tree for exemplar + unknown barcodes • Profile NJ [Muller et al, 04] • Distance between profiles • Neighbor joining tree for the species profiles • Phylogenetic Traversal • Construct NJ-tree from training profiles • Traverse down the tree (from the root) • Choose least distant branch • Substitution models: UNC, JK, K2P, TN.
Statistical model-based • Likelihood ratio test for species membership using MCMC [Matz&Nielsen06] • Impractical runtime even for moderate #species • Scalable models explored: position weight matrices, Markov chains, hidden Markov models • Similar to models used successfully in other sequence analysis problems such as DNA motif finding and protein families
Positional Weight Matrix(PWM) • Assumption: independence of loci • P(x|SP) = P(x1|SP)*P(x2|SP)*…*P(xn|SP) • For each locus, P(xi|SP) is estimated as the probability of seeing each nucleotide at that locus in DB sequences from species SP
Inhomogeneous Markov Chain (IMC) A A C C T T G G • Takes into account dependencies between consecutiveloci A A C C … start T T G G locus 1 locus 2 locus 3 locus 4
Hidden Markov Model (HMM) Same structure as the IMC Each state emits the associated DNA base with high probability; but can also emit the other bases with probability equal to mutation rate Barcode x generated along path p with probability equal to product of emission & transitions along p P(x|HMM) = sum of probabilities over all paths Efficiently computed by forward algorithm
Probabilistic model-based methods • HMM not scalable genus level identification
Effect of #barcodes/species • BOLD species with at least 25 barcodes (270 sp, 17197 barcodes) • randomly picked 5-20 barcodes from all species • All remaining barcodes used in testing
Effect of #species • BOLD species with at least 10 barcodes (690 sp, 23558 barcodes) • Randomly picked 100 to 690 species (10 barcodes per species) • All remaining barcodes from picked species used in testing
Conclusions & Ongoing work • Presented an initial comparison of a broad range of species assignment methods • Ongoing work explores further effects • New specie detection • Barcode length/quality • Runtime scalability (up to millions of species) • More datasets