Download
1 / 55
550 likes | 636 Views
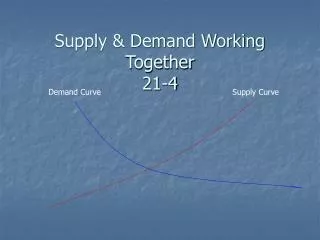
Supply & Demand. The Product Market. LAW OF DEMAND. An inverse relationship exists between price and quantity demanded. As Price Falls… …Quantity Demanded Rises As Price Rises… …Quantity Demanded Falls. LAW OF DEMAND. Demand Curve Market Demand Individual Demand

E N D
Supply & Demand The Product Market
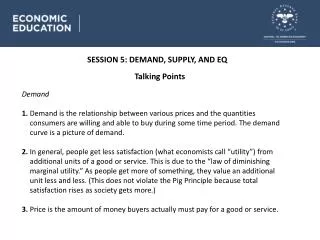
LAW OF DEMAND An inverse relationship exists between price and quantity demanded • As Price Falls… …Quantity Demanded Rises • As Price Rises… …Quantity Demanded Falls
LAW OF DEMAND • Demand Curve • Market Demand • Individual Demand • Horizontal Summation
DOWNWARD SLOPE • Diminishing Marginal Utility
DOWNWARD SLOPE • Diminishing Marginal Utility • Income Effect
DOWNWARD SLOPE • Diminishing Marginal Utility • Income Effect • Substitution Effect
P QD GRAPHING DEMAND Price of Corn P $5 4 3 2 1 Plot the Points CORN 10 20 35 55 80 $5 4 3 2 1 o Q 10 20 30 40 50 60 70 80 Quantity of Corn
P QD GRAPHING DEMAND Price of Corn P $5 4 3 2 1 Plot the Points CORN 10 20 35 55 80 $5 4 3 2 1 o 55 Q 10 20 30 40 50 60 70 80 Quantity of Corn
P QD GRAPHING DEMAND Price of Corn P $5 4 3 2 1 Plot the Points CORN 10 20 35 55 80 $5 4 3 2 1 o Q 10 20 30 40 50 60 70 80 35 Quantity of Corn
P QD GRAPHING DEMAND Price of Corn P $5 4 3 2 1 Plot the Points CORN 10 20 35 55 80 $5 4 3 2 1 o Q 10 20 30 40 50 60 70 80 Quantity of Corn
P QD GRAPHING DEMAND Price of Corn P $5 4 3 2 1 Plot the Points CORN 10 20 35 55 80 $5 4 3 2 1 o Q 10 20 30 40 50 60 70 80 Quantity of Corn
P QD GRAPHING DEMAND Price of Corn P $5 4 3 2 1 Connect the Points CORN 10 20 35 55 80 $5 4 3 2 1 D o Q 10 20 30 40 50 60 70 80 Quantity of Corn
P QD GRAPHING DEMAND Price of Corn What if Demand Increases? P $5 4 3 2 1 CORN 10 20 35 55 80 $5 4 3 2 1 D o Q 10 20 30 40 50 60 70 80 Quantity of Corn
P QD GRAPHING DEMAND Price of Corn Increase in Quantity Demanded P $5 4 3 2 1 CORN 30 40 60 80 + 10 20 35 55 80 $5 4 3 2 1 Increase in Demand D2 D1 o Q 10 20 30 40 50 60 70 80 Quantity of Corn
P QD GRAPHING DEMAND Price of Corn What if Demand Decreases? P $5 4 3 2 1 CORN 10 20 35 55 80 $5 4 3 2 1 D o Q 10 20 30 40 50 60 70 80 Quantity of Corn
P QD GRAPHING DEMAND Price of Corn P Decrease in Quantity Demanded $5 4 3 2 1 CORN -- 10 20 40 60 10 20 35 55 80 $5 4 3 2 1 Decrease in Demand D1 D3 o Q 10 20 30 40 50 60 70 80 Quantity of Corn
DETERMINANTS OF DEMAND • Tastes (Preferences) • Prices of Related Goods • Substitutes & Complements • Unrelated Goods • Income • Normal (Superior) & Inferior Goods • Number of Buyers • Expectations
DETERMINANTS OF DEMAND • Tastes (Preferences) • Prices of Related Goods • Substitutes & Complements • Unrelated Goods • Income • Normal (Superior) & Inferior Goods • Number of Buyers • Expectations
Practice Problems • Activity 1-4 Parts A & B • Activity 1-5
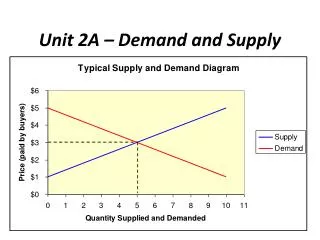
LAW OF SUPPLY A direct relationship exists between price and quantity supplied • As Price Rises… …Quantity Supplied Rises • As Price Falls… …Quantity Supplied Falls
P QS GRAPHING SUPPLY Plot the Points Price of Corn P $5 4 3 2 1 CORN $5 4 3 2 1 60 50 35 20 5 o 5 Q 10 20 30 40 50 60 70 80 Quantity of Corn
P QS GRAPHING SUPPLY Plot the Points Price of Corn P $5 4 3 2 1 CORN $5 4 3 2 1 60 50 35 20 5 o Q 10 20 30 40 50 60 70 80 Quantity of Corn
P QS GRAPHING SUPPLY Plot the Points Price of Corn P $5 4 3 2 1 CORN $5 4 3 2 1 60 50 35 20 5 o 35 Q 10 20 30 40 50 60 70 80 Quantity of Corn
P QS GRAPHING SUPPLY Plot the Points Price of Corn P $5 4 3 2 1 CORN $5 4 3 2 1 60 50 35 20 5 o Q 10 20 30 40 50 60 70 80 Quantity of Corn
P QS GRAPHING SUPPLY Plot the Points Price of Corn P $5 4 3 2 1 CORN $5 4 3 2 1 60 50 35 20 5 o Q 10 20 30 40 50 60 70 80 Quantity of Corn
P QS GRAPHING SUPPLY Price of Corn P S $5 4 3 2 1 CORN $5 4 3 2 1 60 50 35 20 5 Connect the Points o Q 10 20 30 40 50 60 70 80 Quantity of Corn
P QS GRAPHING SUPPLY Price of Corn P What if Supply Increases? S $5 4 3 2 1 CORN $5 4 3 2 1 60 50 35 20 5 o Q 10 20 30 40 50 60 70 80 Quantity of Corn
P QS GRAPHING SUPPLY Price of Corn Increase in Supply P S2 S1 $5 4 3 2 1 CORN 80 70 60 45 30 $5 4 3 2 1 60 50 35 20 5 Increase in Quantity Supplied o Q 10 20 30 40 50 60 70 80 Quantity of Corn
P QS GRAPHING SUPPLY Price of Corn P What if Supply Decreases? S $5 4 3 2 1 CORN $5 4 3 2 1 60 50 35 20 5 o Q 10 20 30 40 50 60 70 80 Quantity of Corn
P QS GRAPHING SUPPLY Decrease in Supply Price of Corn S3 P S1 $5 4 3 2 1 CORN 45 30 20 0 -- $5 4 3 2 1 60 50 35 20 5 Decrease in Quantity Supplied o Q 10 20 30 40 50 60 70 80 Quantity of Corn
DETERMINANTS OF SUPPLY • Resource Prices • Prices of Other Goods • Technology • Taxes & Subsidies • Expectations • Number of Sellers
DETERMINANTS OF SUPPLY • Resource Prices • Prices of Other Goods • Technology • Taxes & Subsidies • Expectations • Number of Sellers
Practice Problems • Activity 1-6 Parts A & B • Activity 1-7
DETERMINANTS OF SUPPLY Combining with Demand • Resource Prices • Technology • Taxes & Subsidies • Prices of Other Goods • Price Expectations • Number of Sellers
P QD P QS MARKET DEMAND & SUPPLY Price of Corn P CORN MARKET CORN MARKET S $5 4 3 2 1 2,000 4,000 7,000 11,000 16,000 $5 4 3 2 1 $5 4 3 2 1 Market Clearing Equilibrium 12,000 10,000 7,000 4,000 1,000 D 7 o Q 2 4 6 8 10 12 14 16 Quantity of Corn
P QD P QS MARKET DEMAND & SUPPLY Price of Corn P CORN MARKET CORN MARKET S Surplus $5 4 3 2 1 At a $4 price more is being supplied than demanded 2,000 4,000 7,000 11,000 16,000 $5 4 3 2 1 $5 4 3 2 1 12,000 10,000 7,000 4,000 1,000 D 7 o Q 2 4 6 8 10 12 14 16 Quantity of Corn
P QD P QS MARKET DEMAND & SUPPLY Price of Corn P CORN MARKET CORN MARKET S $5 4 3 2 1 At a $2 price more is being demanded than supplied 2,000 4,000 7,000 11,000 16,000 $5 4 3 2 1 $5 4 3 2 1 12,000 10,000 7,000 4,000 1,000 Shortage D 11 7 o Q 2 4 6 8 10 12 14 16 Quantity of Corn
P QD P QS MARKET DEMAND & SUPPLY Price of Corn P CORN MARKET CORN MARKET S Surplus $5 4 3 2 1 2,000 4,000 7,000 11,000 16,000 $5 4 3 2 1 $5 4 3 2 1 12,000 10,000 7,000 4,000 1,000 Shortage D 11 7 o Q 2 4 6 8 10 12 14 16 Quantity of Corn
MARKET EQUILIBRIUM • Equilibrium Price & Quantity • Rationing Function of Prices • Changes in Demand • Changes in Quantity Demanded • Changes in Supply • Changes in Quantity Supplied
Single Shifts • Supply Increases • Supply Decreases • Demand Increases • Demand Decreases
Double Shifts • Supply Increases & Demand Decreases • Supply Decreases & Demand Increases • Supply Increases & Demand Increases • Supply Decreases & Demand Decreases
Double Shifts Quantity Price ? • Supply increase; Demand decrease • Supply decrease; Demand increase • Supply increase; Demand increase • Supply decrease; Demand decrease ? ? ?
Welfare Economics • Welfare economicsis the study of how the allocation ofresources affects economic well-being. • Market equilibrium maximizes the total welfare of buyers and sellers.
CONSUMER SURPLUS • Consumer surplus is the buyer’s willingness to pay for a good minus the amount the buyer actually pays for it.
A Consumer surplus P1 B C Demand Q1 How the Price Affects Consumer Surplus (a) Consumer Surplus at Price P Price Quantity 0
A Initial consumer surplus C Consumer surplus P1 B to new consumers F P2 D E Additional consumer Demand surplus to initial consumers Q1 Q2 How the Price Affects Consumer Surplus (b) Consumer Surplus at Price P Price Quantity 0
PRODUCER SURPLUS • Producer surplus is the amount a seller is paid for a good minus the seller’s cost.
Supply B P1 C Producer surplus A Q1 How the Price Affects Producer Surplus (a) Producer Surplus at Price P Price 0 Quantity