Download
1 / 23
470 likes | 950 Views
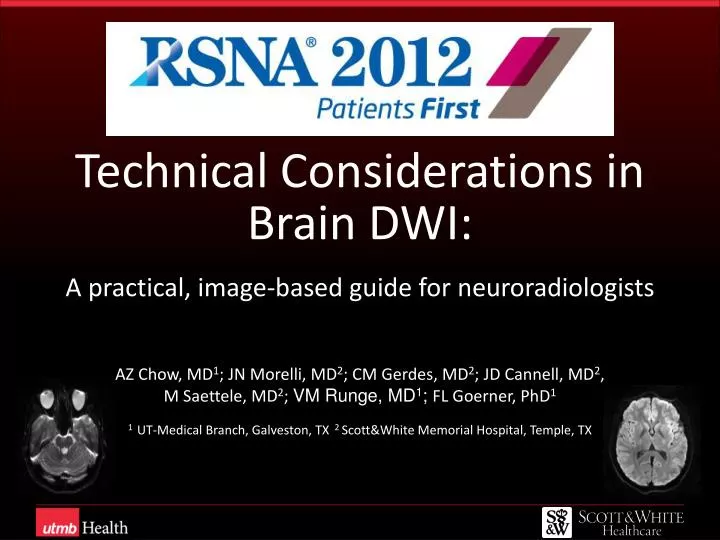
Technical Considerations in Brain DWI:. A practical, image-based guide for neuroradiologists. AZ Chow, MD 1 ; JN Morelli , MD 2 ; CM Gerdes , MD 2 ; JD Cannell , MD 2 , M Saettele , MD 2 ; VM Runge , MD 1 ; FL Goerner , PhD 1.

E N D
Technical Considerations in Brain DWI: A practical, image-based guide for neuroradiologists AZ Chow, MD1; JN Morelli, MD2; CM Gerdes, MD2; JD Cannell, MD2, M Saettele, MD2; VM Runge, MD1; FL Goerner, PhD1 1 UT-Medical Branch, Galveston, TX 2 Scott&White Memorial Hospital, Temple, TX
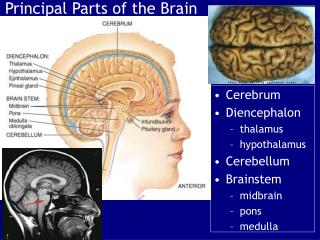
Purpose • To provide imaged-guided instruction of technical considerations of diffusion-weighted imaging (DWI) for neuroradiologists. • To give the physical basis for clinical diffusion-weighted imaging and recent technological developments and practical ways to improve image quality
Theoretical Basis • Diffusion principle is based on Brownian motion of water protons. • Gradients can be applied to measure diffusion with an initial dephasing gradient applied. • A rephasing gradient is then applied. • Interval movement of the protons will cause signal loss proportional to the net movement. RF ADC Gdiff Gf Gp
Theoretical Basis:Cytotoxic edema versus vasogenic edema After an ischemic event, cytotoxic edema can develop within 15-30 minutes and is high signal intensity on DWI. About 6 hours after an ischemic event, capillary leak starts to result in vasogenic edema which has high signal intensity on T2/FLAIR. Increased permeability H2O Blood Vessel Interstitium Cell Cell Cell Cell Cell
Why DWI? Ischemia - chronic white matter changes confounding acute stroke Ischemia - hyperacute stroke (<6 hrs) Infection - subdural empyema Multiple sclerosis DWI FLAIR T1 post contrast DWI T1 post-contrast scan shows low signal intensity collection with contrast enhancement. Restricted diffusion suggests a subdural empyema. T2 shows many hyperintensities in a MS patient FLAIR detects vasogenic edema which takes >6 hours to develop post-ischemic event FLAIR DWI FLAIR shows several areas of ischemic microvascular changes DWI hyperintensities confirm the acute nature of the lesions DWI can detect cytotoxic edema which develops within 15-30 minutes of symptoms DWI reveals an acute infarct Rungeet al. Essentials of Clinical MR. 2011:43. Rungeet al. The Physics of Clinical MR Taught through Images. 2009:129. Rungeet al. Clinical 3T Magnetic Resonance. 2007:68.
Why DWI? • Ischemia • Infection – Abscess • MS • CNS lymphoma • Subacute MTX toxicity • Acute disseminated encephalomyelitis
Diffusion Encoding: Bipolar vs Modified ST Schemes Bipolar Modified ST Stejskal-Tanner RF ADC RF ADC RF ADC Bipolar gradient (p2) Bipolar gradient (p2) Modified ST (p4) Modified ST (p4) Modified ST (p3) Modified ST (p3) Modified ST (p2) Modified ST (p2) Gdiff Gdiff Gdiff Gf Gf Gf -Different diffusion sequences can be performed with varying effects as seen in this left PCA distribution stroke with susceptibility artifact. Gp Gp Gp -The traditional bipolar gradient diffusion is prone to bulk susceptibility artifact (white arrows). Black arrow points to infarct. The differences in susceptibility artifact are circled in red. -Modified ST schemes allow shorter TE times for identical b values, thus increasing SNR -With increases in SNR, parallel imaging factors can be increased, reducing susceptibility artifact. Morelliet al. Invest Radiol. 2010;45(1):29-35
K-space Sampling Strategies:Fast Spin Echo Techniques Fast spin echo (FSE) - modification of spin echo sequence by adding additional 180O pulses within a TR period creating additional echoes and creating an echo train. The total number of pulses = echo train length. Total scan time is equivalent to conventional spin echo scan time divided by the echo train length. Can be combined with other diffusion scans such as BLADE/PROPELLER FSE BLADE EPI Advantages include reduced scan time Penalty of reduction in number of slices acquired in a single scan Can be combined with diffusion scan techniques like BLADE/PROPELLER Attenbergeret al. Invest Radiol. 2009:659.
K-space Sampling Strategies:Single vsMultishot (readout-segmented) EPI Single shot echo planar imaging (ss-EPI) rapidly fills the K space in a linear fashion • Multishot (readout-segmented, rs-EPI) fills the K space with several shots with the center of the K space sampled each time rs-EPI ss-EPI ss-EPI rs-EPI • Fast acquisition (e.g. 1.2 minutes) • Less susceptible to motion • More prone to artifact Slower acquisition time (e.g. 3 minutes) More susceptible to motion Reduction in blur & susceptibility artifact Higher effective resolution Morelli JN, Runge VM, Porter DA, et al, ARRS 2010
K-space Sampling Strategies:PROPELLER/BLADE and Radial Trajectories PROPELLER/BLADE is a unique type of multishotimaging technique that fills the K space in a radial fashion with multiple rotating echo trains ss-EPI PROPELLER/BLADE PROPELLER/BLADE ss-EPI Minimal bulk susceptibility artifact Longer scan time Lower SNR Less motion artifact High bulk susceptibility artifact Rapid scan time Good SNR Susceptibility artifact
The Diffusion Tensor:B-values and SNR The b-value is the summary of the diffusion weighting applied to an image A b-value of 0 generally defaults to a T2-weighted scan; b-value of 1000 correlates to a heavily diffusion-weighted scan. Increasing b-values cause a decrease in signal to noise ratio (SNR) Heavy diffusion weighting with loss of signal in the ventricles (areas of free diffusion) Essentially a T2 scan with high intensity signal in the ventricles b = 0 b = 0 b = 300 b = 300 b = 600 b = 600 b = 900 b = 900 Rungeet al. The Physics of Clinical MRI Taught through Images. 2009: 130.
The Diffusion Tensor:Trace-Weighted Images CC White matter axonal tracts restrain movement of protons to certain directions. Gradients parallel to the tract will cause large signal loss while perpendicular gradients will have minimal signal loss. The trace image is formed by the combination of the individual diffusion tensor images (LR + CC + AP) LR The trace image can incorporate color mapping to maintain directionality data The genu and splenium of the corpus callosum show loss of signal from free diffusion of protons in the transverse plane AP trace AP CC LR Runge et al. The Physics of Clinical MR Taught through Images. 2005: 131.
The Diffusion Tensor:Trace-Weighted Images • Clinical applications: • Surgical planning for tumors near the major critical tracts such as the motor, sensory, and optic tracts (Neurotherapeutics. 2007) • Traumatic brain injury/diffuse axonal injury (Xuet al.J Neurotrauma 2007) • Multiple sclerosis evaluation in context of normal appearing white matter (Testaverdeet al. EurRadiol. 2012.)
The Diffusion Tensor:Construction of ADC Maps 0.0 - 0.2 - 0.4 log(S/S0) small ADC - 0.6 - 0.8 large ADC - 1.0 - 1.2 b-value b=1000 b=0 ADC = - ln(S/S0)/b ADC = apparent diffusion coefficient calculated from ADC maps are constructed for the purposes of obtaining an image with only diffusion information ADC map Courtesy of John E Kirsch, PhD with Siemens Medical
The Diffusion Tensor:T2 Shine Through The need for ADC maps arise because the baseline diffusion sequence with a b-value = 0 is essentially a T2 weighted MRI, so high intensity signals can “shine through” and create a high intensity signal artifact on DWI DWI ADC T2 DWI shows large region of restricted diffusion in the right thalamus/deep white matter. ADC map shows high intensity signal indicating T2 shine through artifact.
The Diffusion Tensor:Exponential Images Exponential images are formed by dividing the signal intensity of DWI by the B0 scan that is pure echo-planar spin-echo T2 weighted image. The resulting signal intensity is exponentially related to the ADC and is also used to rule out T2 shine through artifact. DWI Exponential EPI, b=0
Artifacts:Susceptibility Differences in magnetization properties of adjacent structures/tissues can cause susceptibility gradients and can manifest as distortion/signal changes. Within the brain, most common near parenchyma/sinus interfaces. High signal intensity susceptibility artifact near the mastoid air cells Resolution improved with multishot And less artifactual distortion BLADE/PROPELLER is relatively resistant to susceptibility artifacts Artifactualpontine stretching multishot-EPI ss-EPI BLADE/PROPELLER
Artifacts:Chemical Shift Chemical shift artifact arises when significant fat and water content are adjacent to tissue. In neuroradiology, it is more commonly seen near the scalp. A rs-EPI B0 image with fat sat shows resolution of the chemical shift artifact A rs-EPI B0 image without fat saturation. A chemical shift artifact is seen on the scan in the form of a band in the posterior brain (red arrows).
Artifacts:Eddy Currents Nearby conductive surfaces create small magnetic fields (eddy currents) during application of diffusion gradients resulting in distortion of the main field. The eddy currents can be minimized with active shielding around the modern coils. Surgical hardware-related artifact Conductive object
Considerations at 3T Increase in magnetic field strength (e.g 1.5T -> 3T) can yield improved SNR by allowing shortening of the TE while keeping the b value constant. 3T ss-EPI 3T rs-EPI 1.5T rs-EPI 3T BLADE 1.5T ss-EPI 1.5T BLADE However, susceptibility artifacts are greater at 3T (red arrows).
Additional Considerations at 3T • Magnetic field strength requires being able to apply it fast enough to take advantage of the increase in field strength. However, faster ramping can cause more peripheral nerve stimulation. • Susceptibility artifacts are generally greater at 3T with all other variables held constant. • Parallel imaging generally causes a loss of SNR that prevented widespread usage with 1.5T MRIs, but with increase in SNR for 3T field strengths, parallel imaging can decrease number of pulses needed to complete a sequence • Scans becomes much more sensitive to eddy currents
Summary • The clinical utility of DWI includes evaluation of ischemia, infection/inflammation, neoplasia, and multiple other conditions • Multiple techniques are available to decrease artifacts or enhance DWI including modified ST-schemes, parallel imaging, multishot (readout-segmented) EPI, BLADE/PROPELLER imaging
References • Alexander AL, Lee JE, Lazar M, Field AS. Diffusion tensor imaging of the brain. Neurotherapeutics. 2007 Jul;4(3):316-29. • AttenbergerUI, Runge VM, Stemmer A, Williams KD, Naul LG, Michaely HJ, Schoenberg SO, Reiser MF, Wintersperger BJ. Diffusion weighted imaging: a comprehensive evaluation of a fast spin echo DWI sequence with BLADE (PROPELLER) k-space sampling at 3 T, using a 32-channel head coil in acute brain ischemia. Invest Radiol. 2009 Oct;44(10):656-61. • Hornak, JP. The Basics of MRI. 1996-2011. Rochester Institute of Technology. Accessed 8/2012. http://www.cis.rit.edu/htbooks/mri/ • Morelli JN, Runge VM, Feiweier T, Kirsch JE, Williams KW, Attenberger UI. Evaluation of a modified Stejskal-Tanner diffusion encoding scheme, permitting a marked reduction in TE, in diffusion-weighted imaging of stroke patients at 3 T. Invest Radiol. 2010 Jan;45(1):29-35. • Morelli JN, Runge VM, Ai F, Attenberger U, Vu L, Schmeets SH, Nitz WR, Kirsch JE. An image-based approach to understanding the physics of MR artifacts. Radiographics. 2011 May-Jun;31(3):849-66. • Runge VM, Nitz WR, Schmeets SH, Schoenberg SO. Clinical 3T Magnetic Resonance. New York: Thieme, 2007. • Runge VM, MorelliJN. Essentials of Clinical MR. New York: Thieme, 2011. • Runge VM, Nitz WR, Schmeets SH. The Physics of Clinical MR Taught through Images. New York: Thieme, 2009. • Schaefer PW, Grant PE, Gonzalez RG. Diffusion-weighted MR imaging of the brain. Radiology. 2000 Nov;217(2):331-45. Review. • Testaverde L, Caporali L, Venditti E, Grillea G, Colonnese C. Diffusion tensor imaging applications in multiple sclerosis patients using 3T magnetic resonance: a preliminary study. EurRadiol. 2012 May;22(5):990-7. Epub 2011 Dec 9. • Xu J, Rasmussen IA, Lagopoulos J, Håberg A. Diffuse axonal injury in severe traumatic brain injury visualized using high-resolution diffusion tensor imaging. J Neurotrauma. 2007 May;24(5):753-65.