Download
1 / 66
660 likes | 741 Views
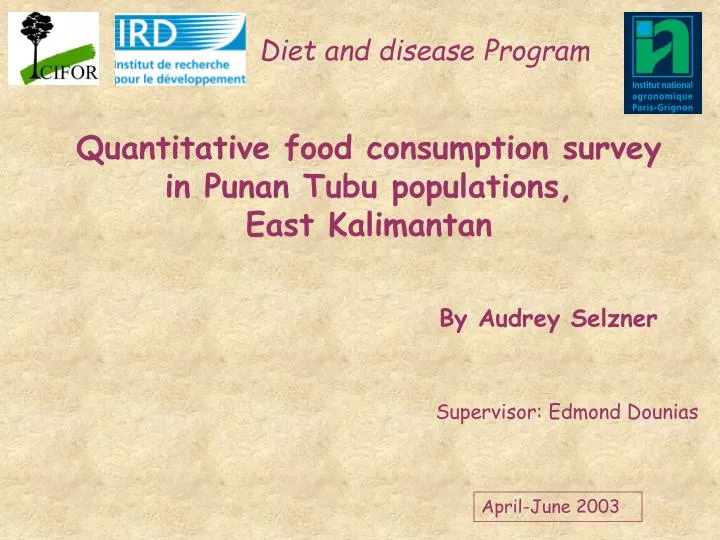
Diet and disease Program. Quantitative food consumption survey in Punan Tubu populations, East Kalimantan. By Audrey Selzner. Supervisor: Edmond Dounias. April-June 2003. Nutrition. Health. Environment. Context of the study. Social / Cultural / Ecological. Objectives of the study.

E N D
Diet and disease Program Quantitative food consumption survey in Punan Tubu populations, East Kalimantan By Audrey Selzner Supervisor: Edmond Dounias April-June 2003
Nutrition Health Environment Context of the study Social / Cultural / Ecological
Objectives of the study Comparison between the diet of the Punan in remote areas and in peri-urban area Social dimension Cultural dimension Biological dimension
Quantitative food consumption survey Research questions • Cultural dimension: • Number of meals? • Food preferences? • Ingredients? • Dishes? • Social dimension: • Cook together? • Eat together? • Food distribution? • Biological dimension: • Quantity? • Nutritional profile?
1. Villages of the study Materials and methods
Materials and methods 2. Study unit: the house Accessibility - + Total 27 43 238
827 preparations weighed during 108 house-weigh days Materials and methods 3. Duration of the survey • 4 consecutive days • not on Sundays • Weigh all ingredients • and dishes
Materials and methods 4. Experimental set up a) Weighing Weight of ingredients before cooking Weight of dishes after cooking Weight of food distribution and leftovers Attendance meal record
Estimation of food consumption in the field Retrospective interview Materials and methods 4. Experimental set up b) In the field Considered as a meal
Retrospective interview Materials and methods 4. Experimental set up c) What about snacks? • Fruits • Food consumed outside of the meals • Beverages • Cakes, biscuits, ice-creams • Prepared meals bought in the city (bakso, soto)
Materials and methods 5. Food samples analysis To assess the nutritional value of the dishes HgCl2 Blend
Age Gender Category 1 0-3 M/F 2 4-6 M/F 3 7-9 M/F 4 10-12 M 5 13-15 M 6 16-19 M 7 20-39 M 8 40-49 M 9 50+ M 10 10-12 F 11 13-15 F 12 16-19 F 13 20-39 F 14 40-49 F 15 50+ F Materials and methods 6. Data analysis Categorization of people
Problems encountered • Imprecision of the scales 2. Under-estimation of snacks 3. Reluctance of some people
A cultural trait Results / Cultural dimension • Number of meals:
Proportion of prepared dishes, leftover dishes and dishes consumed in the fields for each village (cumulative percentages) 7.0 % 100% 17.5 % 21.9 % 90% 20.2 % 12.6 % 80% 70% Dishes consumed in the fields 60% 50% Accessibility Leftover dishes 78.1 % 72.8 % 40% 69.9 % Prepared dishes 30% 20% 10% - + 0% Long Payang Rian Tubu Long Pada n=356 n=302 n=247 Results / Cultural dimension 2. Category of dishes
Results / Cultural dimension 3. Ingredients a) List • Meat: wild boar, deer, macaque, • mouse, squirrel
Results / Cultural dimension 3. Ingredients a) List • Fish (15 different species)
Results / Cultural dimension 3. Ingredients a) List • Shellfish: mussels, river snails • Eggs
Results / Cultural dimension 3. Ingredients a) List • Accompaniment leaves: • cassava, fern, • quailgrass, papaya, kangkung, • cangkok, sawi
Results / Cultural dimension 3. Ingredients a) List • Seasoning leaves: citronella grass, many local ones, onions etc. • Seasoning fruits: plate brush, green rambai, chilli pepper, lemon • Bean, mushroom
Results / Cultural dimension 3. Ingredients a) List • Starchy bases: rice, cassava roots, taro roots, sago starch
Results / Cultural dimension 3. Ingredients a) List • Tempe • Noodles
Origins of ingredients for each village (cumulative percentages) - Accessibility Bought Long Pada From wife N=681 From head of household Rian Tubu From children N=538 Gift Unknown Long Payang + N=451 0% 20% 40% 60% 80% 100% Results / Cultural dimension 3. Ingredients b) Origin Conditioned by access to the market
Origins of ingredients for each village (cumulative percentages) - Accessibility Bought Long Pada From wife N=681 From head of household Rian Tubu From children N=538 Gift Unknown Long Payang + N=451 0% 20% 40% 60% 80% 100% Results / Cultural dimension 3. Ingredients b) Origin Conditioned by access to the market
Origins of ingredients for each village (cumulative percentages) - Accessibility Bought Long Pada From wife N=681 From head of household Rian Tubu From children N=538 Gift Unknown Long Payang + N=451 0% 20% 40% 60% 80% 100% Results / Cultural dimension 3. Ingredients b) Origin Conditioned by access to the market
Origins of ingredients for each village (cumulative percentages) - Accessibility Bought Long Pada From wife N=681 From head of household Rian Tubu From children N=538 Gift Unknown Long Payang + N=451 0% 20% 40% 60% 80% 100% Results / Cultural dimension 3. Ingredients b) Origin Conditioned by access to the market
Origins of ingredients in the global population (cumulative percentages) N=11 N=84 N=150 N=87 N=12 N=42 N=32 N=382 N=737 2 100% Unknown Gift 80% From husband 60% From children 40% From wife 20% Bought 0% Meat Fish Condiments Starchy bases Seasoning fruits Seasoning leaves Accompaniment fruits Accompaniment leaves Accompaniment Shoots Results / Cultural dimension 3. Ingredients b) Origin Depends on the category of ingredients
Origins of ingredients in the global population (cumulative percentages) N=11 N=84 N=150 N=87 N=12 N=42 N=32 N=382 N=737 2 100% Unknown Gift 80% From husband 60% From children 40% From wife 20% Bought 0% Meat Fish Condiments Starchy bases Seasoning fruits Seasoning leaves Accompaniment fruits Accompaniment leaves Accompaniment Shoots Results / Cultural dimension 3. Ingredients b) Origin Depends on the category of ingredients
Origins of ingredients in the global population (cumulative percentages) N=11 N=84 N=150 N=87 N=12 N=42 N=32 N=382 N=737 2 100% Unknown Gift 80% From husband 60% From children 40% From wife 20% Bought 0% Meat Fish Condiments Starchy bases Seasoning fruits Seasoning leaves Accompaniment fruits Accompaniment leaves Accompaniment Shoots Results / Cultural dimension 3. Ingredients b) Origin Depends on the category of ingredients
Results / Cultural dimension 3. Ingredients b) Origin WILD BOAR FISH
Results / Cultural dimension 3. Ingredients b) Origin SAGO OIL
Frequency of ingredients used downstream (total preparations : 356) 300 250 200 150 100 50 0 Fish Eggs Meat Seeds Tempe Noodles Shellfish Mushroom Condiments Starchy bases Seasoning fruits Seasoning leaves Accompaniment fruits Accompaniment leaves Accompaniment flower Accompaniment Shoots Results / Cultural dimension 3. Ingredients c) Frequency of utilization
Higher diversity downstream Accessibility - + Results / Cultural dimension Meat Predominance of wild boar meat
Higher diversity downstream Accessibility - + Accompaniment leaves Results / Cultural dimension Predominance of cassava leaves
Higher diversity downstream Results / Cultural dimension Seasoning fruits and leaves
Accessibility - + Results / Cultural dimension Starchy bases Rice is the staple food
Accessibility - + Results / Cultural dimension 4. Dishes An apparently well-balanced diet a) Consumption
Results / Cultural dimension 4. Dishes b) Food preferences WILD BOAR
+ Accessibility - Results / Cultural dimension 5. Snacks: a) Consumption • 25.1% downstream • 3.5% in middle Tubu • 0.2 % in upper Tubu
Results / Cultural dimension 5. Snacks: a) Consumption • 25.1% downstream • 3.5% in middle Tubu • 0.2 % in upper Tubu
Results / Cultural dimension 5. Snacks: a) Consumption • 25.1% downstream • 3.5% in middle Tubu • 0.2 % in upper Tubu Essentially sweet beverages
Only fruits • Seasonality Results / Cultural dimension 5. Snacks: a) Consumption • 25.1% downstream • 3.5% in middle Tubu • 0.2 % in upper Tubu
Results / Cultural dimension 4. Snacks: b) Consumers
Results / Cultural dimension 4. Snacks: b) Consumers
Results / Social dimension 1. Do households living in the same house cook together? Yes Except 2 houses 2. Do people eat at the same time? Yes Except children who go to school
- Accessibility + Results / Social dimension 3. Food distribution? a) Proportion of shared plates • 25% in upper Tubu • 20% in middle Tubu • 10% downstream
Results / Social dimension 3. Food distribution? b) Who shares?