Download

1 / 25
260 likes | 477 Views
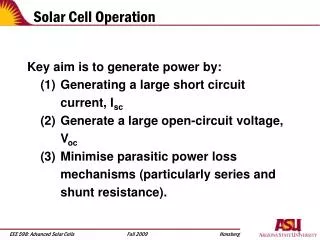
SOLAR CELL TESTING. Basic Structure of a Solar Cell. Basic Photovoltaic Cell Model. This model consists of Built-in voltage Current due to optical generation Series resistance Shunt Resistance . Key Parameters. Open Circuit Voltage, V oc (V)

E N D
Basic Photovoltaic Cell Model • This model consists of • Built-in voltage • Current due to optical generation • Series resistance • Shunt Resistance
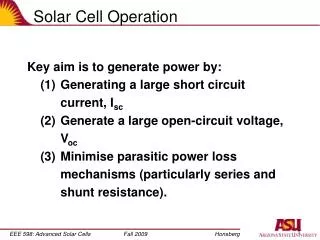
Key Parameters • Open Circuit Voltage, Voc (V) • Short Circuit Current Density, Jsc (mA/cm2) • Max Power Voltage, Vmp • Max Power Current, Imp • Fill Factor, FF • Efficiency, • Diode Ideality Factor, n • Shunt Resistance • Series Resistance • Reverse Saturation Current or Leakage Current
Solar cell – A diode A solar cell is a diode and hence an IV curve of a solar cell under dark conditions will look similar to that of a diode. When illuminated, the photons interact with the material to generate electron hole pairs, which are then driven in opposite directions by the built-in potential.
Standard Test Conditions • AM 1.5G • Temperature = 25C • Important device characteristics can be obtained from the I-V measurements.
Sunlight Simulator Shutter control Status Lamp Air Mass filter housing Calibration solar cell Calibration sun meter Wafer vacuum chuck - backside electrical contact Lamp Power Supply Electrical probe – top side electrical contact
Procedure for Sunlight Simulator • Verify the stage is connected to GND • Verify top contact probe R1 is connected to SMU1
Procedure for Sunlight Simulator • Make sure all fans are working • Turn ON the lamp and wait for a few minutes for it to stabilize. • Open shutter (Remember to wear safety goggles) • Using the calibration cell and the sun meter, adjust the power supply at about 970W or 1 Sun on the sun meter. • Replace the calibration cell with the test sample • Make top and bottom connections to the Keithley 4200 SCS.
Keithley 4200 SCS tutorial • Start KITE. • Select vfd in diode section. (1) • Set Anode to SMU1 and Cathode to GNDU. (2) • Click on Force/Measure button to change sweep parameter. (3) • Click Run Test/Plan button to start sweep. (4) • Click Append button to do another sweep and append the data to the previous sweep. (5)
Keithley 4200 SCS tutorial • To save measured data, select the data tab (6) and click save as button on the right (7). • To view the graph, select the graph tab (8). • To save the graph, right click on the graph and select save as.
Open Circuit Voltage, Voc (V) • In an ideal solar cell, Voc is independent of the illumination intensity. • The open circuit voltage (Voc) occurs when there is no current passing through the cell. V (at I=0) = Voc • To read the open circuit voltage from the graph, locate the point on the voltage axis where the current is zero.
Short Circuit Current Density, Jsc • The short circuit current Isc corresponds to the short circuit condition when the impedance is low and is calculated when the voltage equals 0. I (at V=0) = Isc • To read the short circuit current from the graph, locate the point on the current axis where the voltage is zero. • Divide this current by the area of the solar cell under test, to obtain the current density, Jsc (mA/cm2)
Max Power Point VMP VOC • Draw a rectangle with the origin, VOC and ISC asthe 3 corners. The 4th corner will give the maximum theoretical power, PT. • From the origin, draw a line passing through the maximum theoretical power, PT. This is the load line IMP PMAX PT ISC Load Line The point where the load line crosses the I-V curve is the maximum power point, PMAX for the solar cell, for a given load, with maximum current and maximum voltage.
Max Power Point • The voltage at the maximum power point of the cell is the maximum voltage, VMP. • The current at the maximum power point of the cell is the maximum current, IMP • From the maximum power point, PMAX , draw a line perpendicular to and meet the voltage axis. The maximum power voltage, VMP is given by the value on the voltage axis. The maximum power current, VMP is given by the value on the current axis.
Fill Factor • Fill Factor is the measure of the quality of the solar cell. It is the ratio of the maximum power, Pmax to the theoretical power, PT. FF = PMAX/PT FF = IMP . VMP/ Isc . Voc
Efficiency • Efficiency is the ratio of the electrical power output POUT, compared to the solar power input, PIN, into the PV cell η = POUT/PIN POUT = PMAX (W/m2) For AM 1.5, PIN = 1000 (W/m2)
Reverse Saturation Current • The saturation current I0, is the current that flows in the reverse direction when the diode is reverse biased. It is also called as the leakage current. Saturation current, Io
Shunt Resistance • Shunt resistance is the change in the voltage for change in the unit current and is ideally equal to infinity.
Series Resistance • Series resistance is due to • Resistance of the metal contacts • Ohmic losses in the front surface of the cell • Impurity concentrations • Junction depth • Series resistance reduces both short circuit current and maximum power output of the cell
Series Resistance • For the measurement of internal series resistance, 2 I-V curves of different irradiance but of the same spectrum and at the same temperature are necessary. The series resistance is calculated as: RS = (V2-V1)/(ISC1 – ISC2) V1 ISC1 V2 ISC2
Diode Ideality Factor • The diode ideality factor n, is an indicator of the behavioral proximity of the device under test, to an ideal diode. • n is between 1 and 2, ideally equal to 1.