Download
1 / 28
280 likes | 402 Views
Spatial MODELLING OF FST DISTRIBUTION IN LOUISIANA. Junpyo Hong, Krishna Paudel, and Mike Dunn Department of Agricultural Economics and Agribusiness CENREP Louisiana State University ***[The authors thank Jane Niu for GIS assistance]. Formosan Subterranean Termite.

E N D
Spatial MODELLING OF FST DISTRIBUTION IN LOUISIANA Junpyo Hong, Krishna Paudel, and Mike Dunn Department of Agricultural Economics and Agribusiness CENREP Louisiana State University ***[The authors thank Jane Niu for GIS assistance]
Formosan Subterranean Termite Formosan subterranean termite, Coptotermes formosanus Shiraki, is considered one of the most destructive and aggressive species of termites in the world. Teardrop soldier head of the Formosan subterranean termite (left) and rectangular head of the native subterranean termite (right) (Courtesy of Gregg Henderson, Louisiana State University) Soldiers (orange-brown, oval-shaped head) and workers
U.S. Distribution Graphic by: Nan-Yao Su, University of Florida
Damages • FSTs attack railroad ties, pilings, utility poles, or even live trees. • New Orleans French Quarter Historical District of Louisiana. • Damage estimates exceeding $1 billion per year in those infested areas in US. • These damage costs include property damage, repairs, and control measures
Objective • To simulate a prediction of a spread of the Formosan Subterranean Termite (FST) across the state of Louisiana based on the information of the prior spread pattern and human commercial behavior. • Rationale : From policy perspectives, issues about the pattern of the spread initiate not only when and how much regulatory effort should be exerted, but also where control efforts should be applied over spatial landscapes
Newton’s Gravity Rule ► The force of attraction, F, between two bodies is proportional to the product of their masses, m1 and m2, divided by the square of the distance(d12) between them. ► Gravity model considers not only the source of population, but also the spatial structures and nature of potential infestation areas. ► Gravity model estimates the force of attraction between an origin and a destination, with movement rates being a function of this force. ► Gravity model is more appropriate when the distance to and attractiveness of destination are known or are of interest.
Data Geographic Unit : Zip Code. • FST infestation. ► Source : Wood Destroying Insect Eradication Report (2004, 05, and 06) in Louisiana Department of Agriculture and Forestry. ► Stack all infestation by each zip code. ► 48 infested zip codes, and 414 non-infested zip codes. • Attractiveness in the gravity model. ► the number of housing units. ► Census 2000 Summary File 1 (SF 1) 100-Percent Data’ • Distances ► the reference zip-code area (71360) to the rest of areas. ► a referenced zip-code polygon centroid to centroids of rest of zip-code polygons in ArcGIS.
Assumption • FST spreads via accidental transportation of infested wooden manufactures. • Wood manufacturing companies are wholesale manufacturing companies, not retailers. • Spread initiated from one origin. • Zip code of 71360 was selected as the initial (reference) zip code.
Infestation by ZIP-code * Indicates Metropolitan Statistical Area (:MSA).
Simulation Model • A production-constrained gravity model. • Socio-economic variables (housing units) can connect biological organism to human behavior. • Probability of potentially infested vehicles’ moving from a reference area (71360) to the rest of areas in Louisiana
Simulation Model (cont’d) TRf: information on all vehicles which travel from a reference zip-code (:71360) to an area of FST source, f. AR : a scalar, WR : the total number of wholesale wood manufacturing companies in the reference zip-code, which is ‘5’ in this analysis, Hf : a total number of housing units in location f, dRf : the distance from R to f, and α : the distance coefficient. What is AR ?
Simulation Model (cont’d) “Balancing factors” in the spatial interaction literature. Hf : a total number of housing units in location f, Now, we are ready for prediction of FST infestation on nun-infested areas.
Simulation Model (cont’d) PR containing all the information on the interaction among infested areas now makes the second excursion when the FST infested vehicle move to non-infested zip-code areas. TRu represents the probability of infestation by these vehicles that travel from a reference zip-code to an non-infested zip-code . Hu represents the total number of housing units in non-infested zip-code areas.
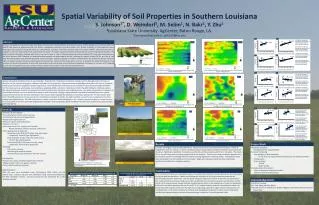
Comparison Between Actual Infestation and Simulated Infestation Adopting 2.0 as Distance Coefficient.
Actual Infested Areas Infested Areas when using distance coefficient is 2.0. The darker places indicate that those area are more likely infested.
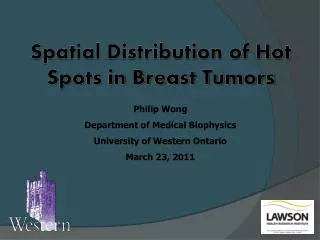
Potential Infested Areas Alpha = 0.1
Potential Infested Areas Alpha = 2.0
Infested areas and Non-infested areas when using distance coefficient is 2.0
Discussion • Attractiveness of the sites, the total number of housing units, play more notable role in the pattern of the spread than the distance does. • Distance coefficient (alpha=2.0) introduced at the original Newton’s gravity model assures that the simulation fits the best to the actual pattern of infestation. • It implies that preventive control against FST on sites less than 30 km distant to the infestation reported area would be more effective than control with monotonous criteria.
Limitations • Assumption supporting the gravity model in this study, i.e., FST spread via accidental transportation of the wholesale wooden manufacturers needs to be verified by a field survey. • Since the fact that FST spread via railroad logs is widely believed, another pattern would be discovered by analyzing a spread involving a railroad network. • Weak connection of infested wooden goods between wholesale manufacturers and consumers’ individual houses should be developed. • Survey of sales among wholesales or retail-sales can provide reliable parameters which can be incorporated in the gravity model.
Prediction on the Number of Zip-code Areas and Their Average Number of Housing Units and Average Distances from The Reference Zip-code (71360) Calculated by Different Distance Coefficients in Potentially Infested Areas in the Future.