Download
1 / 18
180 likes | 356 Views
Estimated GFR Based on Creatinine and Cystatin C. Lesley A Stevens, MD, MS Tufts Medical Center, Tufts University School of Medicine Boston MA. Chronic Kidney Disease-Epidemiology Collaboration UO1 DK 053869, UO1 DK 067651 and UO1 DK 35073. Background.

E N D
Estimated GFR Based on Creatinine and Cystatin C Lesley A Stevens, MD, MS Tufts Medical Center, Tufts University School of Medicine Boston MA Chronic Kidney Disease-Epidemiology Collaboration UO1 DK 053869, UO1 DK 067651 and UO1 DK 35073.
Background • GFR is essential to detection, management, and evaluation of CKD • GFR is difficult to measure and is usually estimated from serum markers • GFR estimates are used to: • Estimate measured GFR • Predict risk for adverse outcomes • Interpretation of GFR estimates depends upon properties of the equations and the filtration markers
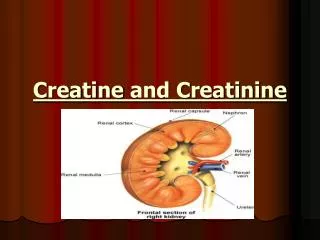
Physiology of endogenous filtration markers • Creatinine • Physiology • MDRD Study equation • CKD-EPI equation • Cystatin C • Physiology • CKD-EPI equations • Predictors of serum levels
Physiology of Endogenous Filtration Markers G(cells, tissues) U X V = GFR x S + TS- TR G-E = GFR x S + TS-TR S= (G - E – TS+TR) /GFR GFR= (G - E – TS+TR)/S G(diet) U X V (kidney) GFR TS TR S E (gut, liver) Estimating equations substitute easily measured clinical surrogates for unmeasured physiological processes
Creatinine Physiology G(muscle) U X V = GFR x S + TS G-E = GFR x S + TS S= (G - E - TS) /GFR GFR= (G - E - TS)/S G(diet) U X V (kidney) GFR TS S E (gut) Age, sex, race, weight
The MDRD Study equation MDRD Study equation Derived from 1628 participants with predominantly non-diabetic CKD (mean GFR 40 ml/min/1.73 m2) Age, sex and race as surrogates for non-GFR determinants Reasonable accuracy in CKD populations Systematic bias (underestimation) of measured GFR at higher levels Imprecision throughout the GFR range
The MDRD Study equation Predicts higher risk for adverse outcomes at lower eGFR Paradoxical higher risk observed in people at higher eGFR Adverse Outcome Estimated GFR 135 30
Chronic Kidney Disease-Epidemiology Collaboration (CKD-EPI) • Goal:Develop and validate improved estimating equations • Diverse dataset of individuals with & without kidney disease, and across range of measured GFR and age • Additional surrogates for non-GFR determinants • Inclusion criteria:study population >250; availability of serum samples; quality control data • Final studies • Category 1: 10 studies; equation development (random selection of 2/3 of data) and internal validation (remaining 1/3 of data) • Category 2: 16 studies; external validation Levey et al Ann Int Med 2009; 150: 604 612
Clinical Characteristics of CKD-EPI Datasets Levey et al Ann Int Med 2009; 150: 604 612
CKD-EPI Equation GFR = 141 x [min(Scr/κ),1)α x max(Scr/κ),1)-1.209 ] x Age-0.993x1.018 [if female] x [1.157 if Black] α is 0.329 for females and 0.411 for males; min indicates minimum of Scr/ or 1, and max indicates maximum of Scr/ or 1 Levey et al Ann Int Med 2009; 150: 604 612
Comparison of the Performance of the MDRD Study and CKD-EPI equations (Validation dataset) 75th %ile Underestimation precision bias 25th %ile MDRD Study CKD-EPI Overestimation Levey et al Ann Int Med 2009; 150: 604 612
Comparison of distribution of estimated GFR for MDRD Study and CKD-EPI equations (NHANES 1999-2004) Values are plotted at the midpoint. Levey et al Ann Int Med 2009; 150: 604 612
Cystatin C and the Risk of Death and Cardiovascular Events among Elderly Persons Shlipak et al. N Engl J Med 2005;352:2049-60
Relationship of Plasma Level and GFR for Cystatin C G(all cells,factors ?) G(diet ?) U X V (kidney) GFR TR S E(?)
CKD-EPI Pooled CystatinDatabase (4 studies, N=3134) Stevens LA, et al. Am J Kidney Dis. 2008;51:395-406
Cystatin C vs Creatinine Equation CKD-EPI Cystatin Pooled Dataset; 4 studies; 3,134 individuals Δ=mGFR-eGFR. Positive value indicates underestimate IQR, interquartile range P30, percentage of esteimates within 30% of measured GFR *Refit MDRD Study equation Stevens LA, et al. Am J Kidney Dis. 2008;51:395-406
Non-GFR Determinants of Cystatin C vs Creatinine in patients with CKD *Adjusted for GFR, GFR measurement error, age, sex and race BUN UCR Percent change in Creatinine UUN UPI UPR Pi BMI Wt BMI Diabetes Albumin Glucposec Diabetes HB CRP CRP SBP MAP WBC WBC Significant for both cystatin C and serum creatinine Significant for cystatin C only Significant for Serum creatinine only Not significant for either cystatin and serum creatinine Percent change in cystatin C Stevens et al KI 2008
Summary • All endogenous filtration markers have non-GFR determinants that affects interpretation of their accuracy as well as prediction of risk • The CKD-EPI equation is more accurate than the MDRD Study equation • Less bias at eGFR >60 • Similar performance at eGFR <60 • Imprecision remains • Cystatin C based estimates • Provide similar or less accurate estimates of measured GFR in populations with CKD • Non-GFR determinants are not well understood but may explain some of the improved risk prediction