Download
1 / 6
60 likes | 140 Views
FFCA PROVINCIAL EXAM RESULTS 2012-2013. The following slides show the performance of FFCA and Alberta students on grades 3, 6 & 9 provincial achievement tests (PATs) and grade 12 diploma exams.

E N D
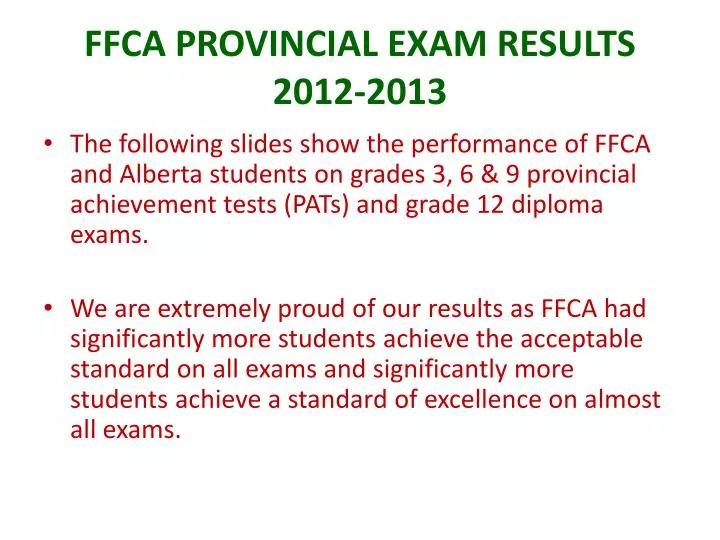
FFCA PROVINCIAL EXAM RESULTS2012-2013 • The following slides show the performance of FFCA and Alberta students on grades 3, 6 & 9 provincial achievement tests (PATs) and grade 12 diploma exams. • We are extremely proud of our results as FFCA had significantly more students achieve the acceptable standard on all exams and significantly more students achieve a standard of excellence on almost all exams.
This graph shows the percentage of FFCA and Alberta grade 3 students that achieved acceptable and excellence standards on the provincial achievement tests in 2012-2013.
This graph shows the percentage of FFCA and Alberta grade 6 students that achieved acceptable and excellence standards on the provincial achievement tests in 2012-2013.
This graph shows the percentage of FFCA and Alberta grade 9 students that achieved acceptable and excellence standards on the provincial achievement tests in 2012-2013. Note that only exams for first semester Science 9 students were written because of the Calgary and Area flooding in June when the remainder of exams were cancelled.
This graph shows the percentage of grade 12 students that achieved acceptable and excellence standards on the diploma exams in 2012-2013.
This graph shows the percentage of grade 12 students that achieved acceptable and excellence standards on the diploma exams in 2012-2013. Note that participation rates on all exams indicated with an * were reduced as students were exempted due to the Calgary and Area flooding in June.