Download
1 / 14
140 likes | 306 Views
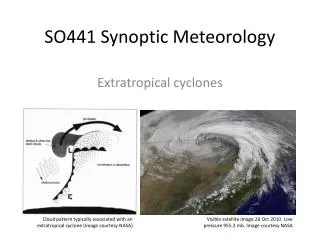
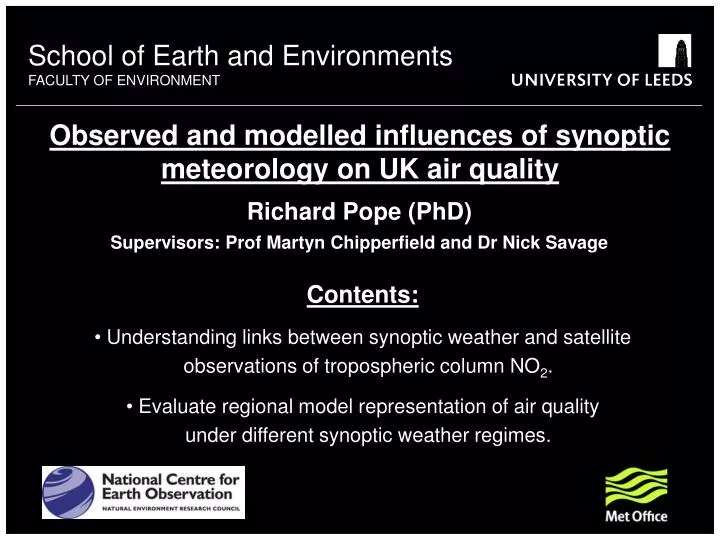
Observed and modelled influences of synoptic meteorology on UK air quality. Richard Pope (PhD ) Supervisors: Prof Martyn Chipperfield and Dr Nick Savage. School of Earth and Environments FACULTY OF ENVIRONMENT. Contents: Understanding links between synoptic weather and satellite

E N D
Observed and modelled influences of synoptic meteorology on UK air quality Richard Pope (PhD) Supervisors: Prof Martyn Chipperfield and Dr Nick Savage School of Earth and Environments FACULTY OF ENVIRONMENT • Contents: • Understanding links between synoptic weather and satellite • observations of tropospheric column NO2. • Evaluate regional model representation of air quality • under different synoptic weather regimes.
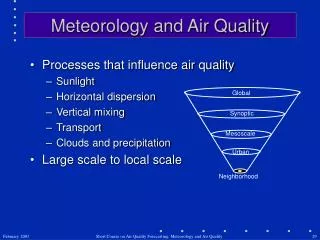
Motivation: Poor UK air quality results in: • An average premature loss of 7-8 months off life expectancy. • Approximately 50,000 premature deaths per year. • An annual cost of £8-20 billion to the British health service. • Hazardous atmospheric chemical species include: • Ozone (O3) • Nitrogen Dioxide (NO2) • Sulphur Dioxide (SO2) • Particulate Matter (PM 2.5 & 10) • Human health effects include: • Asthma • Reduced lung function and disease • Eye irritation
Satellite datasets provide a useful tool to evaluate AQ models, despite high retrieval error and uncertainty. We use LWTs to bin the OMI NO2 data in different meteorological regimes. These synoptic climatologies can be used to validate models once mission comes to the end of its life. Do not always need day by day comparisons with larger variability; instead can use these generic climatologies. Satellite Datasets:
On-board NASA Aura satellite. Nadir viewing with footprint size of 312 km2. UV-VIS range of 270-500 nm. OMI data from 2004 – present. We look at 2006-2010. Tropospheric Column NO2 data (DOMINO vn 2.0) from Tropospheric Emissions Monitoring Internet Service, available at http://www.temis.nl/airpollution/no2.html Approximate UK overpass time of 13.00 local time. Ozone Monitoring Instrument:
Lamb Weather Types: LWTs characterise the synoptic weather over the UK, based on an objective scheme using daily midday grid point mean sea level pressure from NCEP reanalysis data, in the form of the 27 codes below.
OMI NO2 Synoptic Composites: Summer Cyclonic Winter Cyclonic Transport of column NO2 off mainland. Winter Anticyclonic Summer Anticyclonic Higher winter column NO2. Build up of column NO2. OMI Column NO2: 1015 molecules/cm2
OMI NO2 Synoptic Composite Anomalies: Summer Cyclonic Winter Cyclonic Black polygons show significant anomalies. Negative anomalies show column NO2 transport. Positive anomalies show column NO2 accumulation . Winter Anticyclonic Summer Anticyclonic Process more noticeable in winter due to higher column NO2. OMI Column NO2: 1015 molecules/cm2
OMI NO2 Wind Flow Composites: South Westerly Flow South Easterly Flow Leeward plume transport from source regions.
AQUM Configuration: Height Surface - 38 km: 39 Levels Initial and Boundary Conditions: Meteorology - Global UM Chemistry - MACC Forecasts & GEMS reanalyses UKCA (United Kingdom Chemistry and Aerosols) Tropospheric Chemistry Scheme Online Model: Meteorology and Chemistry Coupled Emissions Datasets: UK - NAEI - 1km x 1km Europe - EMEP - 50km x 50km Shipping - ENTEC - 5km x 5km Longitude 0.11◦ x 0.11◦ Horizontal Resolution Latitude Chemical Species: O3, NO2, NO, CO, PAN, HCHO, OH, PM 2.5 & 10
AQUM NO2 Synoptic Composites: Summer Cyclonic Winter Cyclonic Similar spatial patterns to observations. Summer Anticyclonic Winter Anticyclonic More intense model winter spatial patterns. AQUM Column NO2: 1015 molecules/cm2
AQUM NO2 Synoptic Composite Anomalies: Winter Cyclonic Summer Cyclonic More intense model winter spatial patterns. Summer Anticyclonic Winter Anticyclonic Missing heterogeneous loss of N2O5 on aerosol so more column NO2. AQUM Column NO2: 1015 molecules/cm2
AQUM Tracer Synoptic Composites: Tracer introduced into NOx sources. Life time = 1 day. No chemical reactions. Summer Cyclonic Winter Cyclonic Similar transport and accumulation of column tracer as AQUM NO2. Summer Anticyclonic Winter Anticyclonic Larger accumulation of tracer in summer. Tracer Column: 1015 molecules/cm2
AQUM Tracer Synoptic Composites Anomalies: Summer Cyclonic Winter Cyclonic Winter column tracer and NO2 are similar; distribution dominated by meteorology. Summer Anticyclonic Winter Anticyclonic Summer column tracer and NO2 are different; tracer life time too long, chemistry more active in summer. Column Tracer: 1015 molecules/cm2
Summary: • We successfully used LWT and OMI data to find climatological composites of air quality under different synoptic regimes. • Pope RJ, Savage NH, Chipperfield MP, Arnold SR and Osborn TJ. (2014). The influence of synoptic weather regimes on UK air quality: analysis of satellite column NO2. Atmospheric Science Letters, DOI: 10.1002/asl2.492 • The AQUM reproduces the air quality – synoptic weather patterns seen in the observations. However, it overestimates the relationships in winter as it is missing a NO2 sink of N2O5hydrolisis on aerosol. • We use a idealised tracer to show in winter synoptic weather is the primary driver of UK/northern Europe NO2 pollution spatially. However in summer, chemical processes are increasingly important.