Download
1 / 10
100 likes | 205 Views
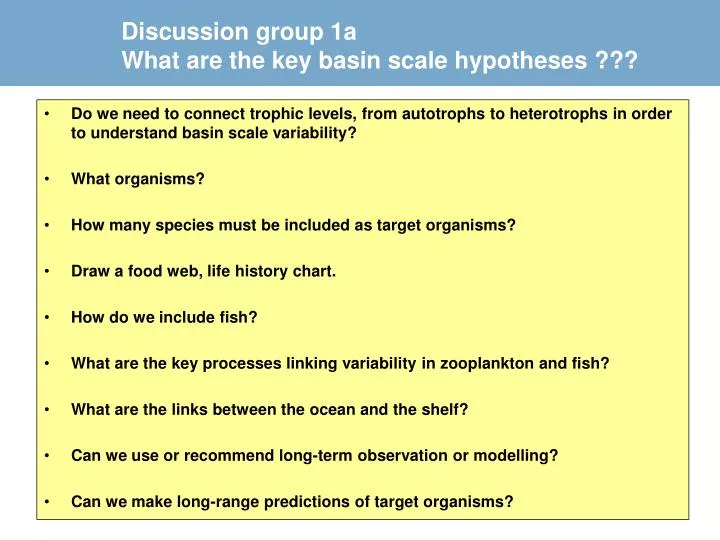
Discussion group 1a What are the key basin scale hypotheses ???. Do we need to connect trophic levels, from autotrophs to heterotrophs in order to understand basin scale variability? What organisms? How many species must be included as target organisms? Draw a food web, life history chart.

E N D
Discussion group 1aWhat are the key basin scale hypotheses ??? • Do we need to connect trophic levels, from autotrophs to heterotrophs in order to understand basin scale variability? • What organisms? • How many species must be included as target organisms? • Draw a food web, life history chart. • How do we include fish? • What are the key processes linking variability in zooplankton and fish? • What are the links between the ocean and the shelf? • Can we use or recommend long-term observation or modelling? • Can we make long-range predictions of target organisms?
Discussion group 1a • What are the key basin scale hypotheses that we are interested in?
Discussion group 1aHypothesis x • What species and trophic levels are involved? • What geographical/oceanographic domains are involved? • Draw the relevant food web/life history chart… • What are the key processes linking the species/trophic levels? • What are the key processes linking spatial domains • What are the key processes influencing target species demography? • What observations do we need? • What chance is there of making long-range predictions?
Discussion group 1a • What are the key basin scale hypotheses that we are interested in?
What species and trophic levels are involved? What geographical/oceanographic domains are involved? Draw the relevant food web/life history chart… What are the key processes linking the species/trophic levels? What are the key processes linking spatial domains What are the key processes influencing target species demography? What observations do we need? What chance is there of making long-range predictions? Discussion group 1aHypothesis 2
Hypotheses…. • How interconnected are the regions around the Atlantic rim? • Pan-Atlantic species with strong exchange between regions – Calanus – metapopulation or panmictic? • Pan-Atlantic species with weak exchange between regions, but nevertheless coherent aspects of dynamics – regional stocks with basin scale forcing (cod) • Basin scale data/models as boundary conditions for regional models • Basin scale changes in plankton diversity • Changes in regional productivity – top down vs bottom up? – needs basin scale understanding as background
What species and trophic levels are involved? What geographical/oceanographic domains are involved? Draw the relevant food web/life history chart… What are the key processes linking the species/trophic levels? What are the key processes linking spatial domains What are the key processes influencing target species demography? What observations do we need? What chance is there of making long-range predictions? Primary mesozoop and euphausids., lesser detail on micro/phyto, how to represent losses of mesozoo - link to local models of planktivorous fish – eg. capelin Mesozoo directly linked to basin scale- fish more regional. NA is good place to test whether basin scale necessary Target species Calanus/pseudocal/euphausids/planktivorous fish (redfish/herring/sprat/blue whiting/sandlance/capelin/Norway pout). Calanus – metapopulatins linked by deep and surface circulation Pseudocalanus – food production ? Predation Western Atlantic equivalent of OWSM/OWSI (deep water) (automated measurements from buoys) Information on microzooplankton biomass. Data assimilation for generation of gridded time series of biological state variables. Scenario forecasts are possible Discussion group 1aHypothesis 1 Changes in regional productivity – top down vs bottom up?
Relationships between surface and deep populations Summer surface population Reproduction and lipid accumulation Reproduction and lipid accumulation Spring ascent Spring ascent Autumn descent Terminal lineage Diapause Diapause Terminal lineage Overwinter deep population Heath et al. 2004 Backhaus (1994) hypothesis revisited