Download
1 / 50
500 likes | 648 Views
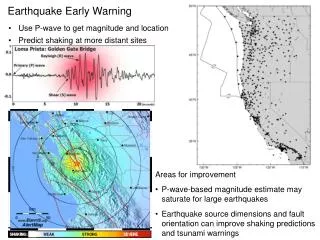
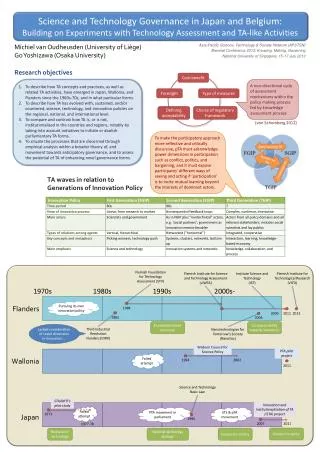
Early Warning Strategy. Joel Taylor UCL Centre for Sustainable Heritage Review of Preventive Conservation in Europe Early Warning System Mitigation. Review of Preventive Conservation in Europe. Literature Review – published work on best practice and what should be done

E N D
Early Warning Strategy Joel Taylor UCL Centre for Sustainable Heritage • Review of Preventive Conservation in Europe • Early Warning System • Mitigation
Review of Preventive Conservation in Europe Literature Review – published work on best practice and what should be done Questionnaire – views on current practice and what is being done Expert panel – end-user views on current practice and what could be done
Gaps in Preventive Conservation Strategy Techniques often not integrated Damage functions not known for many materials and difficulty in generalising from one material to a range of materials Synergy of agents of deterioration Effects of open display, e.g. historic houses and contemporary exhibitions Data analysis deficit
(Problems with) Standards Dosimeters cannot utilise existing standards – why? • RH levels often mid-range, and concentrate on physical damage and mould growth • Temperature incorporates human comfort • Light levels incorporate visibility • Few standards on pollutants (concentration-based) • No accepted standards for VOCs The numbers, rather than the ways of achieving them, gained acceptance.
(Problems with) Standards 2 More recently, standards have evolved from single numbers to ranges
Conclusions from the Literature Review Preventive conservation strategies are drawing upon risk management more and more Acceptable change is being defined The rate of deterioration for different locations can be compared, using techniques such as isoperms An overall strategy can accommodate different aims Interdisciplinary methodologies are replacing standards
Questionnaire Questionnaire on monitoring Sent out to determine how attitudes and practice reflect literature 31 heritage institutions of varying size from 18 European countries responded ArchiveMuseumHistoricHouse
Is monitoring systematic? Everyone that monitors at all, monitors temperature and RH. Very few people monitor pollutants For many risks, there appeared to be very little correlation between perceived threat and amount of monitoring -except pests and organic acids (risks with visible impact) All of the institutions that did not consider temperature or RH as important risk factors (or didn’t know), monitored them Pollution monitoring is independent of location - proportionally, there is more pollution monitoring in rural locations than urban ones
Questionnaire conclusions Awareness of risks was related to standards, and therefore intellectual access to information Pollution and organic acids were not frequently monitored Rational decision-making is distorted by external factors, such as lack of resources
Expert Panel First end-user workshop in Krakow
Outcomes of discussion Light, temperature and RH commonly monitored. Pollutants, less so Differences in monitoring are more related to the size and type of institution than differences in culture or country Data overload is the most common problem Most systems rely on single parameter monitoring, not considering synergistic effects
Overall recommendations ‘Data overload’ a problem Preventive conservation methods often not integrated EWO should help define relationship between risk and damage EWO should be easy to use Need for EWO to be relevant to existing methodologies
Convergence of findings from literature review, questionnaire and expert views -1 Conservation assessments need to account for synergy among different risks (all research strands revealed this) Consistent way of comparing different risks needs to be carried out in practice (all strands) More data analysis should be encouraged in practice (all stands) Theory and practice emphasise some risks over others (literature review and questionnaire)
Convergence of findings from literature review, questionnaire and expert views - 2 Understanding, and expression, of rate of change for chemical deterioration is still required (literature review and workshop ) Data overload and lack of integration of methods within preventive conservation (questionnaire and workshop) Communication between scientists and the general public is required (literature review and workshop) Integration of existing preventive conservation methodologies is desirable (literature review and workshop)
Developing a new preventive conservation strategy for the MASTER sensors Integrate EWO sensor with existing preventive conservation methodologies Understand and express, of rate of change for chemical deterioration Account for synergy between agents Encourage more data analysis (simplicity)
Existing Preventive Conservation Methods • Environmental Monitoring • Condition Assessment • Location Assessment • Risk Assessment Vantaa, 2000
FUTURE PAST DETERMINISTIC CATASTROPHIC Deterioration Condition Survey Risk Assessment Environmental Monitoring Location Assessment
Properties of the EWO-G dosimeter Deterioration Dosimeter Response False PositiveResponse, no damage False Negative Damage, no response Maritime vapours Unusual VOCs Inherent deterioration Rate of reaction Physical damage Biological damage True positive Response and damage Passive layers on objects Agents reducing reaction rates Uncertainty (Ashley-Smith) Stability (Bradley and Thickett) Dose-response (Tetreault, Brimblecombe, Larsen) Isoperms (Sebera, Michalski, TWPI) JNFs (Ashley-Smith . et al.) True negative No response or damage
Classification in Preventive Conservation • Building (ASHRAE, 1999; 2003) • Condition (Keene, 1991; 2002) • Environment (CIE, 1995; Larsen, 1996) • Risk (Waller, 1994; 2003) • Value (Delta plan, Van der Reyden 1996) Different kinds of institution will have different aims and requirements in terms of assessment and control
Types of institution -1 1 Archive • Climate controlled and air is purified • Possibly more of a storage than exhibition space • Collections very vulnerable or valuable • A realistic optimum 2 Purpose Built Museum • Environmental control is possible - Thomson’s Class 1 museum • Will probably meet the needs of human comfort and existing standards for organic objects • Consistent with existing ideas of good preservation 3 Historic House museum • Historic buildings and museums with limited resources - Thomson’s Class 2 museum. • Most organic objects would be well preserved in this environment
Types of institution - 2 4 Open structure • Open display when the environment is difficult to control May have open windows or little UV protection • For robust organic objects but not valuable or vulnerable • Just outside levels that might be recommended for a museum object 5 External store with no control • Very little control or protection. • Environment is open to the outdoors in some respects and provides shelter rather than environmental control. • Not to be aspired to but indicates location’s performance
Strategy • Only required data is analysed • Methods are integrated • Diagnostic • Reduce uncertainty in each method • Does not assume what data exists (or ignore existing data)
Interpreting the dosimeter Responding to identified hazard, possibly a long-standing problem. Diagnostic monitoring recommended. Expectation and PPO response Yes 1 2 3 4 5 1 2 3 4 5 Identified hazard causing damage? Check existing data. Once value is assessed, prioritise mitigation. Problem may be synergistic, or an unmonitored element of the environment. Assess unmonitored hazards. Location Risk EnvironmentCondition No Carry out risk assessment, location assessment, monitor environment look at collection.
Trøndelag Folk Museum Example New, purpose built museum. HVAC system. Category 2 (purpose built museum gallery) Environment – ‘Class 1’ museum. Monitor temp, RH and light but not pollutants. No natural light (only UV) Object condition – No visible deterioration Location – Checked regularly, no problems Risk – No risk assessment carried out but major environmental threats perceived
Expectation Responding to identified hazard, possibly a long-standing problem. Diagnostic monitoring recommended. Yes 1 2 3 4 5 1 2 3 4 5 Check existing data. Identified hazard causing damage? Once value is assessed, prioritise mitigation. Problem may be synergistic, or an unmonitored element of the environment. Assess unmonitored hazards. Location Risk EnvironmentCondition No Carry out risk assessment, location assessment, monitor environment look at collection.
PPO response (gallery) Responding to identified hazard, possibly a long-standing problem. Diagnostic monitoring recommended. Yes 1 2 3 4 5 1 2 3 4 5 Check existing data. Identified hazard causing damage? Once value is assessed, prioritise mitigation. Problem may be synergistic, or an unmonitored element of the environment. Assess unmonitored hazards. Location Risk EnvironmentCondition No Carry out risk assessment, location assessment, monitor environment look at collection.
Interpretation Pollutants are the only hazards not monitored. None of the monitored hazards reveal a problem We can deduce that pollutants are the problem Pollutant gases are undetected by the museum and the EWO dosimeter reveals the problem Diagnostic monitoring would reveal that NO2 and O3 levels are higher inside than outside (during the field test)
Pollutants identified Responding to identified hazard, possibly a long-standing problem. Diagnostic monitoring recommended. Yes 1 2 3 4 5 1 2 3 4 5 Check existing data. Identified hazard causing damage? Once value is assessed, prioritise mitigation. Problem may be synergistic, or an unmonitored element of the environment. Assess unmonitored hazards. Location Risk EnvironmentCondition No Carry out risk assessment, location assessment, monitor environment look at collection.
Diagnostic monitoring EWO-S dosimeter can be used for assessments of external pollution, as a diagnostic monitoring campaign Shorter exposure time of twenty eight days suitable for investigating problems
Mitigation What to do when a hazard has been determined
Risk chain Risk assessment Environmental monitoring Dosimetry Condition assessment release exposure consequence attack There are various ways of assessing and mitigating damage which relate to different stages of the process. Part of this is determining which points are critical for hazards to have an effect on a collection.
Dependencies in risk Outcomes are dependent on a series of prior events, which can be generalised. What needs to take place for damage to happen? What are the critical points and pathways in this chain of events?
Dependency modelling These are deductive, top-down methods of analyzing risks in system design. It involves specifying a ‘top event’ to analyze (damage). Followed by identifying all of the associated elements in the system that could cause that ‘top event’ to occur.
An example… Damage to object from pollution Interaction of pollutant with collection Exposed surfaces for deposition AND No attractive deposition surfaces Presence of pollutant in building AND OR Generation of pollutant internally Infiltration through natural ventilation Infiltration through HVAC
Relationships in model In a positively phrased dependency model, AND dependencies are points of weakness because all events need to occur for the higher event to take place. OR dependencies represent points of strength, because of alternatives options. Can turn these into ANDs through investigation. Probabilities can be applied to each event, so cost effectiveness and efficiency can be determined for any action.
Modelling deterministic risk Events often about extent of impact, not presence or absence of impact. Deterministic risks cannot be modelled this way. The threshold levels can be used to create ‘steps’ for each event, so pathway has defined levels. E.g. presence is NO2 at 10 ppb, rather than 5ppb. Steps based on object deterioration and MASTER calibration.
A general model of a test site museum shows possible ways in which NO2 can affect collections Damage to objects e.g. 5ppb NO2 for one year Presence of pollutant in gallery No scavenger in display area AND Presence of pollutant in building No attractive deposit surfaces AND Internal generation Infiltration from outside OR OR External presence of pollutant Intake filtration OR Reaction from NO Unflued heating appliance Cellulose nitrate break down HVAC Filter Intake position OR
Monitoring showed that internal concentrations were actually higher than external concentrations Damage to objects e.g. 5ppb NO2 for one year Presence of pollutant in gallery No scavenger in display area AND 6ppb Presence of pollutant in building No attractive deposit surfaces AND Internal generation Infiltration from outside OR OR External presence of pollutant Intake filtration OR Reaction from NO Unflued heating appliance Cellulose nitrate break down 4ppb HVAC Filter Intake position OR
Consequently the critical pathways can be identified using the model Damage to objects e.g. 5ppb NO2 for one year Presence of pollutant in gallery No scavenger in display area AND Presence of pollutant in building No attractive deposit surfaces AND Internal generation from NO2reaction Infiltration from outside OR External presence of pollutant Intake filtration AND Intake position
Acknowledgements May Cassar and Nigel Blades European Commission 5th FP MASTER project team You