Download
1 / 14
140 likes | 307 Views
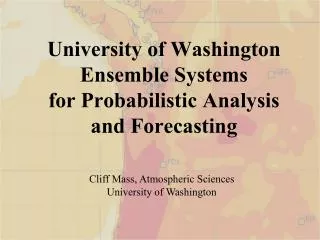
Skill and cost-loss analysis of a probabilistic nutrient ensemble prediction. J-F Exbrayat 1 , NR Viney 2 , H-G Frede 1 and L Breuer 1 1 ILR, Justus-Liebig-University Giessen, Germany 2 CSIRO Land and Water, Canberra, Australia EGU General assembly 2011 – 8/04/11. Algal disturbances.

E N D
Skill and cost-loss analysis of a probabilistic nutrient ensemble prediction J-F Exbrayat1, NR Viney2, H-G Frede1 and L Breuer1 1 ILR, Justus-Liebig-University Giessen, Germany 2 CSIRO Land and Water, Canberra, Australia EGU General assembly 2011 – 8/04/11
Algal disturbances http://www.swanrivertrust.wa.gov.au
Solutions • Different strategies to reduce nutrient input into the estuary (e.g. reduce fertilisers, traps...) • Other policies about oxygenation, non-nutrient contaminants... • Concentration reduction targets derived to reduce the total N input into the estuary: • Short term: 2.0 mg N/L • Long term: 1.0 mg N/L Under current conditions, how good are models to correctly predict this event?
Hydro-biogeochemical models Large variety of conceptualisations [Breuer et al., 2008 HSJ] No superior one [Kronvang et al., 2009 JEM] Uncertain single predictions
Probabilistic Multi-Model Ensembles • Consider the full range of predictions (no averaging techniques) • Evaluation based on the frequency of occurrence of a particular event (usually exceeded thresholds) • Useful in risk assessment / decision-making [Cloke and Pappenberger, 2009 JH]
Ellen Brook River catchment Zammit et al. (2005), Ecol. Model. Swan River Trust (2009)
Multi Model Members Large differences in considered processes
Contingency table [Zhu et al., 2002 BAMS] • Hit Rate HR = h/(h+m) • False alarm Rate FR = w/(w+r) “Magic spell” “I consider that the event is predicted/will occur if at least xx% of the models say so”
Evaluation • High-frequency TN concentrations: • Calibration over 3 years (1994-1996) • Validation over the 5 next years (1997-2001) • Potential economic value of using each model to correctly predict exceeded target of 2 mg N /L [Richardson, 2000 QJRMS] • Same with the probabilistic ensemble (4 models = 4 prob. levels: 25%, 50%, 75% and 100%) α: cost/loss ratio f: frequency of the event in historical data
Relative Operating Curve 25% 50% 75% 100% [Exbrayat et al., submitted GRL]
Potential economic value “Envelope of the ensemble” [Exbrayat et al., submitted GRL]
Conclusions • Generally, the ensemble has more value than the single models • Consider the many case studies yet to come… [Diaz et al., 2008 Science]
Expenses • Expected expense of using the model • Expected expense with historical data (observed frequency of the event) • Expected expense with a perfect forecast
Potential economic value • Ratio of the expense linked to the use of the prediction to the minimum possible expense • Equivalent to [Richardson, 2000 QJRMS] • α: cost/loss ratio • f: frequency of the event in historical data