Download
1 / 1
10 likes | 99 Views
Applying Vertical Radial Plume Mapping to Estimate Emission Rate in Petro Chemical Industry.

E N D
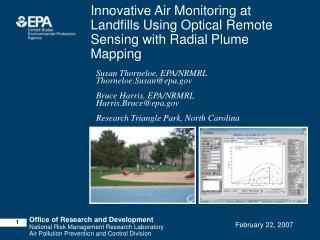
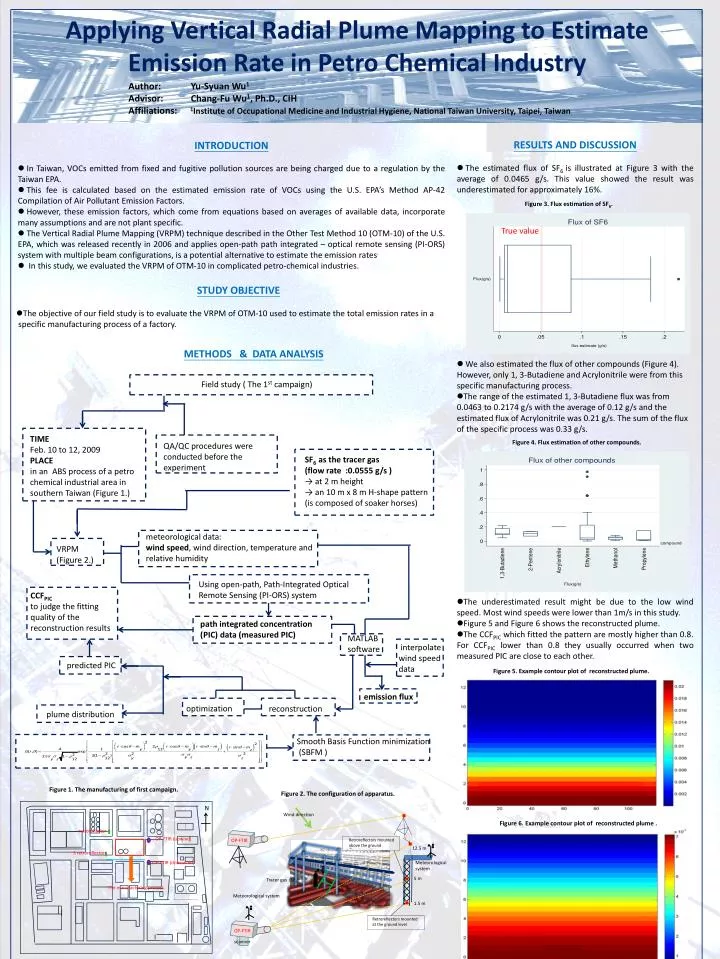
Applying Vertical Radial Plume Mapping to Estimate Emission Rate in Petro Chemical Industry Author: Yu-Syuan Wu1 Advisor: Chang-Fu Wu1, Ph.D., CIHAffiliations: 1Institute of Occupational Medicine and Industrial Hygiene, National Taiwan University, Taipei, Taiwan • RESULTS AND DISCUSSION • The estimated flux of SF6 is illustrated at Figure 3 with the average of 0.0465 g/s. This value showed the result was underestimated for approximately 16%. • INTRODUCTION • In Taiwan, VOCs emitted from fixed and fugitive pollution sources are being charged due to a regulation by the Taiwan EPA. • This fee is calculated based on the estimated emission rate of VOCs using the U.S. EPA’s Method AP-42 Compilation of Air Pollutant Emission Factors. • However, these emission factors, which come from equations based on averages of available data, incorporate many assumptions and are not plant specific. • The Vertical Radial Plume Mapping (VRPM) technique described in the Other Test Method 10 (OTM-10) of the U.S. EPA, which was released recently in 2006 and applies open-path path integrated – optical remote sensing (PI-ORS) system with multiple beam configurations, is a potential alternative to estimate the emission rates. • In this study, we evaluated the VRPM of OTM-10 in complicated petro-chemical industries. Figure 1. The manufacturing of first campaign. N retroreflector OP-FTIR (upwind) Figure 3. Flux estimation of SF6. 3 retroreflectors OP-FTIR (downwind) True value The manufacturing process • STUDY OBJECTIVE • The objective of our field study is to evaluate the VRPM of OTM-10 used to estimate the total emission rates in a • specific manufacturing process of a factory. METHODS & DATA ANALYSIS • We also estimated the flux of other compounds(Figure 4). However, only 1, 3-Butadiene and Acrylonitrile were from this specific manufacturing process. • The range of theestimated 1, 3-Butadiene flux was from 0.0463 to 0.2174 g/s with the average of 0.12 g/s and the estimated flux of Acrylonitrile was 0.21 g/s. The sum of the flux of the specific process was 0.33 g/s. Field study ( The 1st campaign) Figure 4. Flux estimation of other compounds. TIME Feb. 10 to 12, 2009 PLACE in an ABS process of a petro chemical industrial area in southern Taiwan (Figure 1.) QA/QC procedures were conducted before the experiment SF6 as the tracer gas (flow rate :0.0555 g/s ) → at 2 m height → an 10 m x 8 m H-shape pattern (is composed of soaker horses) meteorological data: wind speed, wind direction, temperature and relative humidity • The underestimated result might be due to the low wind speed. Most wind speeds were lower than 1m/s in this study. • Figure 5 and Figure 6 shows the reconstructed plume. • The CCFPIC which fitted the pattern are mostly higher than 0.8. For CCFPIC lower than 0.8 they usually occurred when two measured PIC are close to each other. VRPM (Figure 2.) Using open-path, Path-Integrated Optical Remote Sensing (PI-ORS) system CCFPIC to judge the fitting quality of the reconstruction results Figure 5. Example contour plot of reconstructed plume. path integrated concentration (PIC) data (measured PIC) MATLABsoftware interpolate wind speed data predicted PIC emission flux Figure 2. The configuration of apparatus. optimization reconstruction plume distribution Wind direction Figure 6. Example contour plot of reconstructed plume . Smooth Basis Function minimization (SBFM ) OP-FTIR Retroreflectors mounted above the ground 12.5 m Meteorological system 5 m Tracer gas (SF6) Meteorological system 1.5 m Retroreflectors mounted at the ground level OP-FTIR 1 scanner