Download
1 / 15
150 likes | 261 Views
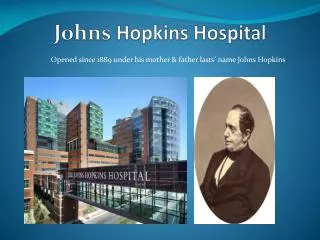
DLC Diversity Climate Survey Third Annual Diversity Conference Weaving Together the Fabric of Johns Hopkins. Presenter: James R. Calvin Moderator: Daniel Lee Latrobe 106 Wednesday, November 1, 2006. Insights and Next Steps: The Johns Hopkins Diversity Climate Survey.

E N D
DLC Diversity Climate SurveyThird Annual Diversity ConferenceWeaving Together the Fabric of Johns Hopkins Presenter: James R. Calvin Moderator: Daniel Lee Latrobe 106 Wednesday, November 1, 2006
Insights and Next Steps: The Johns Hopkins Diversity Climate Survey • In early 2004 The Johns Hopkins Institutions Diversity Leadership Council (DLC) in carrying out its charter from President William R. Brody initiated a broad and inclusive two-year consultative process to construct and implement a first ever all Hopkins Institutions opinion survey. As the survey plan went forward the thinking by DLC was to collect data and share it with the individual schools, divisions, and organizations to shed light on issues related to perceptions about diversity and workplace climate across the Hopkins Institutions. Today is a short session of early opinion survey considerations, impressions and insights via a demographic snapshot from the survey.
Johns Hopkins Institutions Diversity & Inclusion Statement • Johns Hopkins is a community committed to sharing values of diversity and inclusion in order to achieve and sustain excellence. We firmly believe that we can best promote excellence by recruiting and retaining a diverse group of students, faculty and staff and by creating a climate of respect that is supportive of their success. This climate for diversity, inclusion and excellence is criticalto attaining the best research, scholarship, teaching, health care and other strategic goals of the Health system and the University. Taken together these values are recognized and supported fully by the Johns Hopkins Institutions leadership at all levels.Further, we recognize that the responsibility for excellence, diversity and inclusion lies with all of us at the Institutions: leadership, administration, faculty, staff and students.
Definition of Workplace Climate • For DLC it is those factors that contribute to creating the perception of a positive, supportive and meaningful workplace. It includes the extent to which the workplace (department, division, school, organization) is an enjoyable, pleasant place to work because people work together well and treat each other with respect that is reciprocated. It is also the extent to which faculty and staff believe that they have a collaborative opportunity to contribute to organizational success in a meaningful way.
DLC Statement on Civility • Within the Johns Hopkins Institutions this is behavior that consistently understands, respects and embraces differences and helps to create a sustainable environment where all are valued and can be productive.
DLC Survey Collaboration & Distribution • As the DLC vetting process unfolded the final survey design and strategy for collecting and providing data to schools and divisions was administered in a partnership consisting of the Office of Development and Diversity (ODD), the Office of Equal Opportunity & Affirmative Action Programs, School of Medicine, the Applied Physics Lab (APL), and JHU Human Resources. ODD posted and managed the data collection for the DLC survey with the exception of APL. The ODD summarized data has been provided to individual schools, divisions, and departments for their individual analyses and future planning purposes.
Snapshot #1 What the DLC Can Tell You Today JHU and SOM Employees Demographic Data • Total Employees: 14,762 employees completed a survey. The sub-total for staff is 11,453 and for faculty the sub-total is 3309. • Employees by Employment Category SOM and JHU Admin Officers138699 Faculty202812813309 Senior Staff278421864970 Support Staff352628586384 Total 8351641114762 SOMJHU-SOMTotal
Snapshot #2 What the DLC Can Tell You Today Employees by Gender • Employees by Gender (All JHU) FacultyStaffTotal Women117775988775 Men213238555987 SOM JHU WomenMenWomenMen Faculty6701358507774 Staff 437419493224 1906 5044330737312680 SOM (Totals)JHU (Totals)
Snapshot #3 Important DLC Survey Development Steps • The DLC in its survey development steps and implementation stages was openly sensitive to supporting the needs expressed by leadership parties in specific Johns Hopkins units. While the Applied Physics Laboratory (APL) survey was different in format and questions, the remaining three units had similar questions and format, but were modified to meet the specific needs of the University, the School of Medicine (SOM), and the Johns Hopkins Health System.
Snapshot #4 JHU & SOMClimate Surveys • The preliminary information to follow is presented in percentages based on the number of received JHU and SOM climate surveys. The questions in these surveys were similar, however additional questions were added to the SOM survey by request. In addition, the JHU data were collected by Division/School, while the SOM data were collected by Department.
Snapshot #5 Percentage of Total Respondents JHU (1542) and SOM (2410) by Position, Gender, Race/Ethnicity JHUSOM Position Admin Officer 5%4% Faculty 25%24% Senior Staff 32%24% Support Staff38%48% Gender Male 37% 28% Female63%72% Primary Race/Ethnicity African American /Black17% 17% Native American/Alaskan0.3% 0.1% Asian/Pacific Islander4%7% Latino 3%2% White 73%70% Other 3% 3%
Snapshot #6 Selected Survey Responses For our conversation today the DLC combined the two most positive responses ‘very satisfied’ or ‘satisfied’; and ‘strongly agree’ and ‘agree’for the percentages that are shown. When asked, “Overall how satisfied are you with your experience at Johns Hopkins?” ‘very satisfied’ or ‘satisfied.’ JHUSOM Overall 77% 76% African American/Black 52% 62% Asian/Pacific Islander 61%70% Latino 78%93% White 85% 82% Male 79% 77% Female 76% 78%
Snapshot #7 Selected Survey ResponsesFor our conversation today the DLC combined the two most positive responses ‘very satisfied’ or ‘satisfied’; and ‘strongly agree’ and ‘agree’for the percentages that are shown. When presented with the statement “My colleagues treat me with civility, the percentage of respondents who ‘agreed’ or ‘strongly agreed’ JHUSOM Overall 77% 78% African American/Black 50% 62% Asian/Pacific Islander 58%75% Latino 80%71% White 84% 83% Male 79% 82% Female 77% 77%
Snapshot#8 Selected Survey ResponsesFor our conversation today the DLC combined the two most positive responses ‘very satisfied’ or ‘satisfied’; ‘strongly agree’ and ‘agree; or ‘almost always’ or ‘always’’ for the percentages that are shown. When asked, “Overall how satisfied are you with the climate with your school/division? (JHU or SOM)” the percentage of respondents who answered ‘very satisfied’ or ‘satisfied’’ JHUSOM Overall 65% 65% African American/Black 35% 56% Asian/Pacific Islander 59%75% Latino 72%71% White 73% 70% Male 70% 71% Female 63% 62%
We Are at the End of Our Presentation Today • The DLC Wants Your Comments, Ideas, Thoughts and Questions?