Download
1 / 42
420 likes | 501 Views
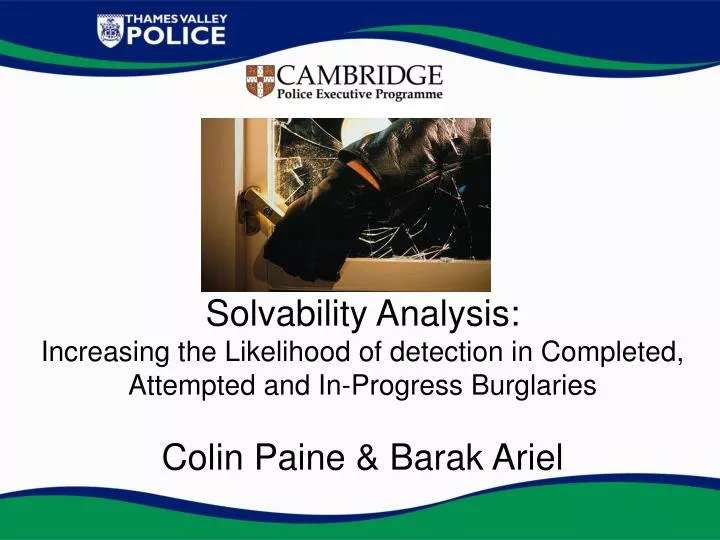
Solvability Analysis: Increasing the Likelihood of detection in Completed, Attempted and In-Progress Burglaries Colin Paine & Barak Ariel. Data Set I. All residential burglaries in Thames Valley from 1 st March 2010 to 31 st October 2011 11,769 full offence residential burglaries

E N D
Solvability Analysis: Increasing the Likelihood of detection in Completed, Attempted and In-Progress Burglaries Colin Paine & Barak Ariel
Data Set I • All residential burglaries in Thames Valley from 1st March 2010 to 31st October 2011 • 11,769 full offence residential burglaries • Excludes distraction burglary, aggravated burglary and non-residential burglaries.
Data Set II • All residential burglaries in Thames Valley from 1st March 2010 to 31st October 2011 • 2,537 attempted residential burglaries • Excludes distraction burglary, aggravated burglary and non-residential burglaries.
Data Set III • All in-progress residential burglaries in Thames Valley from1stNovember 2009 and 31st October 2012 (i.e. Burglary emergencies). • N = 6,119 • Includes aggravated, distraction and non residential burglaries.
Data Sources • Collapsed four databases: • “Socrates” – the forensic information database • CEDAR – the crime recording database • IMM – the crime investigation management application • Command and control – the incident resourcing system (only this system used for data on in-progress offences). • (Datasets aligned using crime numbers & cleansed to remove duplicates)
Limitations Unable to study ‘Suspect Named’ variable (Greenberg 1970). Unable to study intelligence as a variable Insufficient capacity to study ANPR as a variable
Variables 129 variables in the data set 57 useful variables, such as: • Time range of offence, • time to first officer attendance, • offence witnessed, • suspect seen, • suspect disturbed, • fingerprints recovered, • DNA recovered, • items left at scene by offender, • rural/town location, • media appeal completed, • called in as burglary in progress.
Solved Crimes • Detected crime selected as the definition of solved crime. 1926 detected crimes (12.99%) • Removed secondary detections – 525 removed • 1401 detected crimes (9.79%) • 4 methods of disposal included; charges, reprimands, final warnings, cautions. • Majority are charges
Attempted burglary is harder to solve than the full offence.
Over 96% of all detections are obtained in 180 days. 1 Burglary took 5 and half years to solve.
Data Quality Assurance and Cleansing • Random selection and review of quality of data capture in 100 burglaries from the sample • Review of missing data to determine whether it will undermine internal validity. • Data was pretty good!
Compared percentage of marks recovered in solved sample and unsolved sample.
Compared percentage of marks recovered in solved sample and unsolved sample.
Compared percentage of marks recovered in solved sample and unsolved sample.
Compared percentage of burglaries in progress in solved sample and unsolved sample.
New solvability factors identified: media appeal, vehicle stolen in the crime, anything left at scene by the offender, stolen property recovered, reported as a burglary in progress, DNA and footwear marks recovered.
The most powerful solvability factors occur the least often.
372 solved residential burglaries had no solvability factors present. Sample of 62 reviewed.
It is possible to predict the outcome of case dependent on presence of solvability factors. Predictive accuracy would be enhanced if suspect named variable were added, conspiracy charges removed from sample and each variable were statistically weighted.
The presence of solvability factors in burglaries is not uniform
5.59 Reported Burglaries in Progress in TVP per day • 6.11% result in an arrest at or near scene. • 4% daytime and 7% nighttime.
Just 6.11% result in an arrest in immediate response to the initial call
The arrest rate following burglaries in progress is not uniform across police areas.
The percentage likelihood of capture does not decrease with the passage of time.
The optimum number of units to send to a burglary in progress is 19 to 21.
Once interaction effects have been taken into account those factors that most strongly predict arrest remain deployment of the helicopter and the number of units deployed. • For every additional officer the likelihood of making an arrest increases by 6%. • Deploying more units is more effective than just deploying officers – better to send 2 single crewed units than 1 double crewed. For every additional unit the odds of making an arrest increases by 13%. • The attendance of dog units is correlated with arrest, but is masked by the effect of number of officers. • The impact of Sergeant attendance is not statistically significant.
Burglary is hard to solve. Most burglaries have no solvability factors. The most powerful solvability factors occur infrequently. • The recovery of forensic material is more powerfully correlated than expected, especially for completed burglaries. • Solved attempted burglaries are more strongly correlated with burglaries in progress, witnesses and the offender being disturbed. • Solved full burglaries are more strongly correlated with forensic recovery. • It is possible to adopt a case screening model based on the presence of solvability factors. • This is now ready for an RCT to test a case screening approach.