Download
1 / 17
180 likes | 384 Views
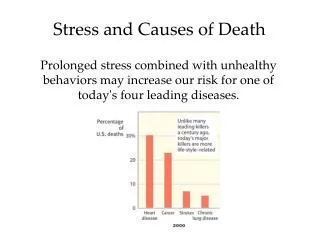
The epidemiology of hypertension and current treatment challenges Francesco P Cappuccio FRCP FFPH FAHA Professor of Cardiovascular Medicine & Epidemiology Consultant Physician Warwick Medical School and UHCW NHS Trust Coventry. Leading causes of death worldwide (1990). Chronic. Communicable.

E N D
The epidemiology of hypertension and current treatment challengesFrancesco P Cappuccio FRCP FFPH FAHAProfessor of Cardiovascular Medicine & EpidemiologyConsultant PhysicianWarwick Medical School and UHCW NHS TrustCoventry
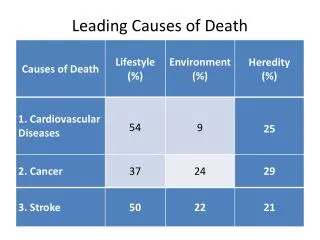
Leading causes of death worldwide (1990) Chronic Communicable Cancer Violent Number of deaths (million) Lancet 1997;349:1269-76
High blood pressure Tobacco High cholesterol Underweight Unsafe sex High BMI Physical inactivity Alcohol Indoor smoke from solid fuels Iron deficiency 0 1 2 3 4 5 6 7 8 Attributable Mortality (In millions; total 55,861,000) Proportion of deaths attributable to leading risk factors in the world (2000) ~56M
Proportion of deaths attributable to leading risk factors in Europe (2000) ~2.5M
8 7 6 CV mortality: -fold increase 5 4 3 2 1 0 115/75 135/85 155/95 175/105 BP (SBP/DBP mm Hg) CV Mortality RiskDoubles with each 20/10 mm Hg BP increment Lewington S, et al. Lancet 2002; 60: 1903-1913
0 CV event Stroke CHD −10 −20 −30 20–21 −40 21–28 −50 30–39 Relative risk reduction (%) Long-term antihypertensive treatment reduces CV risk Neal B, et al. 2000
DBP/SBP uncontrolled Major CV events/year* DBP uncontrolled 50 000 SBP uncontrolled 40 000 30 000 20 000 10 000 0 Medicated Unmedicated Total Uncontrolled BP results in major CV events* Uncontrolled BP results in major CV events (myocardial infarction [MI], stroke or CV-related death) Flack JM, et al. 2002 *Study of the US population
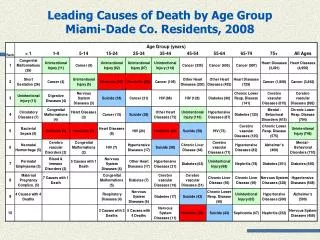
Diabetes Stroke & TIA Hypertension C.H.D. Data on >8,000 General Practices in England (>97%) Q.O.F. Blood pressure (audit) targets Modified from Ashworth M et al. Br Med J 2008;337:on-line November
Health Survey for England (n=8,834 in 2003 and n=7,478 in 2006) Prevalence of awareness, treatment and control in 2003 and 2006 Falaschetti E et al. Hypertension 2009;53:480-6
Discordance between increase in use of medications and failure to control BP Hypertension: >140/90 mmHg or >130/80 mmHg in diabetics Raised TC: >4.5 mmol/L Raised LDL-C: >2.5 mmol/L EUROASPIRE Surveys - E.S.C. Vienna 2007
Adjusted Odds Ratios Cases 267 Controls 534 p<0.01 Average SBP achieved with Rx in last 5 yrs Du et al. BMJ 1997 Stroke Mortality and Quality of Hypertension Control
Multiple antihypertensive agents are needed to reach BP goal Trial (SBP achieved) ASCOT-BPLA (136.9 mmHg) ALLHAT (138 mmHg) IDNT (138 mmHg) RENAAL (141 mmHg) UKPDS (144 mmHg) ABCD (132 mmHg) MDRD (132 mmHg) HOT (138 mmHg) AASK (128 mmHg) 1 2 3 4 Average no. of antihypertensive medications Adapted from Bakris et al. Am J Med 2004;116(5A):30S–8 Dahlöf et al. Lancet 2005;366:895–906
What are the barriers to an effective management of hypertension? • Physician and health-professional • Attitudes • Training • Knowledge and awareness of guidelines • Measurement issues • Clinical inertia • Reluctance to change treatment despite failure to achieve targets • Lack of regular review • Co-morbidity • Organisation • Lack of follow-up • Migration • Failure to refer to specialist centres • Patient • Life-style • Poor compliance (and concordance) • Ineffective drugs • Missed doses • Side effects or Adverse drug reactions • White coat • Need for additional agents • Resistance to treatment • Loss to follow-up • Lack of awareness of targets
Resistant hypertension: Definition & Estimates • NICE/BHS Guidelines: “defined when a patient’s BP is not controlled to recommended BP goals, i.e. <140/90 mmHg, despite treatment with an appropriate combination of three drug therapies, i.e. A+C+D, prescribed at their maximum recommended and/or tolerated doses.” • Not synonymous with uncontrolled BP • Approx. 1.5m people in the UK are on 3+ BP-lowering drugs • 55% of them remain uncontrolled (~825,000) • Estimated prevalence of resistant hypertension 0.5 – 1.0m • Most resistant hypertension is due to systolic hypertension
Conclusions • Blood pressure control is still sub-optimal • High risk groups are at increased risk of inadequate BP control • Ineffective drug therapy and non-compliance with national guidelines are important reasons • Better choice of more effective drugs, used in appropriate combination, can improve the management of hypertension, reduce the burden of avoidable vascular events and reduce overall healthcare costs • Resistant hypertension may account for a significant number of uncontrolled hypertension on conventional drug therapy
Doctor - Try this. If it doesn’t work, come back and I will give you something else Patient - Wouldn’t it be better if you gave me that something else right now?