Download
1 / 1
10 likes | 119 Views
New Earthquake Catalogs For Southern California And Their Use In Earthquake Forecasting Yan Y. Kagan, David D. Jackson and Yufang Rong, University of California, Los Angeles. Southern California Earthquake Catalog With Extended Sources. Summary

E N D
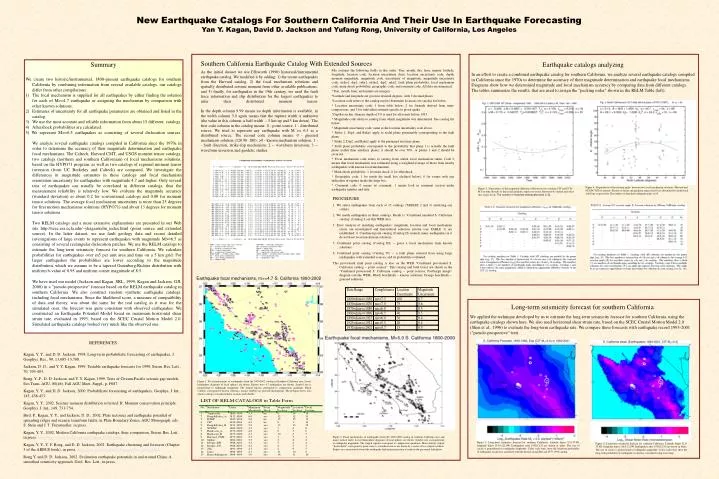
New Earthquake Catalogs For Southern California And Their Use In Earthquake Forecasting Yan Y. Kagan, David D. Jackson and Yufang Rong, University of California, Los Angeles Southern California Earthquake Catalog With Extended Sources • Summary • We create two historic/instrumental, 1800-present earthquake catalogs for southern California by combining information from several available catalogs. our catalogs differ from other compilations: • The focal mechanism is supplied for all earthquakes by either finding the solution for each of M>=4.7 earthquake or assigning the mechanism by comparison with other known solutions. • Estimates of uncertainty for all earthquake parameters are obtained and listed in the catalog. • We use the most accurate and reliable information from about 15 different catalogs. • Aftershock probabilities are calculated. • 5) We represent M>=6.5 earthquakes as consisting of several dislocation sources. We analyze several earthquake catalogs compiled in California since the 1970s in order to determine the accuracy of their magnitude determination and earthquake focal mechanisms. The Caltech, Harvard CMT, and USGS moment tensor catalogs, two catalogs (northern and southern Californian) of focal mechanisms solutions, based on the HYPO71 program, as well as two catalogs of regional moment tensor inversion (from UC Berkeley and Caltech) are compared. We investigate the differences in magnitude estimates in these catalogs and focal mechanism orientation uncertainty for earthquakes with magnitude 4.7 and higher. Only several tens of earthquakes can usually be correlated in different catalogs, thus the measurement reliability is relatively low. We evaluate the magnitude accuracy (standard deviation) as about 0.2 for conventional catalogs and 0.08 for moment tensor solutions. The average focal mechanism uncertainty is more than 25 degrees for first motion mechanisms solutions (HYPO71) and about 13 degrees for moment tensor solutions. • Two RELM catalogs and a more extensive explanations are presented in our Web site http://scec.ess.ucla.edu/~ykagan/relm_index.html (point source and extended source). In the latter dataset, we use fault geology data and recent detailed investigations of large events to represent earthquakes with magnitude M>=6.5 as consisting of several rectangular dislocation patches. We use the RELM catalogs to estimate the long-term seismicity forecast for southern California. We calculate probabilities for earthquakes over m5 per unit area and time on a 5 km grid. For larger earthquakes the probabilities are lower according to the magnitude distribution, which we assume to be a tapered Gutenberg-Richter distribution with uniform b-value of 0.95 and uniform corner magnitude of 8.5. • We have used our model (Jackson and Kagan, SRL, 1999; Kagan and Jackson, GJI, 2000) in a "pseudo-prospective" forecast based on the RELM earthquake catalog in southern California. We also construct random synthetic earthquake catalogs, including focal mechanisms. Since the likelihood score, a measure of compatibility of data and theory, was about the same for the real catalog as it was for the simulated ones, the forecast was quite consistent with observed earthquakes. We constructed an Earthquake Potential Model based on maximum horizontal shear strain rate, evaluated in 1993, based on the SCEC Crustal Motion Model 2.0. Simulated earthquake catalogs looked very much like the observed one. Earthquake catalogs analyzing In an effort to create a combined earthquake catalog for southern California, we analyze several earthquake catalogs compiled in California since the 1970s to determine the accuracy of their magnitude determination and earthquake focal mechanisms. Diagrams show how we determined magnitude and focal mechanism accuracy by comparing data from different catalogs. The tables summarize the results, that are used to assign the "pecking order" shown in the RELM Table (left). File contains the following fields in this order: Year, month, day, hour, minute, latitude, longitude, location code, location uncertainty (km), location uncertainty code, depth, moment magnitude, magnitude code, uncertainty of magnitude, magnitude uncertainty code, strike1, dip1, rake1, strike2, dip2, rake2, fault plane probability, focal mechanism code, main-shock probability, geographic code, and comment code. All data are numerical. *Year, month, hour, and minute are integers *Latitude and longitude are given in decimal degrees, with 3 decimal places *Location code refers to the catalog used to determine location; see catalog list below. * Location uncertainty code: 1 from table below, 2 for formula derived from inter-comparisons, and 3 for individual estimate specific to given quake. *Depth is in km. Generic depth of 9.9 is used for all events before 1933. * Magnitude code refers to catalog from which magnitude was determined. See catalog list below. * Magnitude uncertainty code: same as the location uncertainty code above. * Strike 1, Dip1, and Rake1 apply to nodal plane presumably corresponding to the fault plane. * Strike 2, Dip2, and Rake2 apply to the presumed auxiliary plane. * Fault plane probability corresponds to the probability that plane 1 is actually the fault plane (rather than auxiliary plane); it should be over 50%, or planes 1 and 2 should be reversed. * Focal mechanism code refers to catalog from which focal mechanism taken. Code 0 means that focal mechanism was estimated using a weighted average of those from nearby earthquakes with known focal mechanisms. * Main-shock probability: 1 for main shock, 0 for aftershock. * Geographic code: 1 for inside the small box (defined below), 0 for events with any indication of rupture inside the large box. * Comment code: 0 means no comment; 1 means look in comment section under earthquake number and date. As the initial dataset we use Ellsworth (1990) historical/instrumentalearthquake catalog. We modified it by adding: 1) the recent earthquakes from the Harvard catalog, 2) the focal mechanism solutions and spatially distributed seismic moment from other available publications, and 3) finally, for earthquakes in the 19th century, we used the fault trace information and slip distribution for the largest earthquakes to infer their distributed moment tensor.In the depth column 9.99 means no depth information is available, in the width column 5.0 again means that the rupture width is unknown (the value in this column is half-width -- 5 km up and 5 km down). The first code column in the catalog means: 0 - point source, 1 - distributed source. We tried to represent any earthquake with M >= 6.5 as a distributed source. The second code column means: 0 - guessed mechanism solution (320 90 180); >0 - known mechanism solution: 1 -- fault direction, strike-slip mechanism; 2 -- waveform inversion; 3 -- waveform inversion and geodetic studies Figure 4. Dependence of the rotation angle between two focal mechanism solutions (Harvard and NCEDC-MT on latitude. Results of linear and quadratic regression fit are illustrated by dashed and solid line, respectively. The number of matched earthquake pairs is 69. Figure 3. Dependence of the magnitude difference M between two catalogs CIT and UCB-MT on time. Results of linear and quadratic regression fit are illustrated by dashed and solid line, respectively. The number of matched earthquake pairs is 33. PROCEDURE 1. We select earthquakes from each of 15 catalogs (TABLES 2 and 3) satisfying our criteria. 2. We match earthquakes in these catalogs. Result is "Combined unedited S. California catalog" (Catalog I, see this WEB site). 3. Error analysis of matching earthquakes: magnitude, location and focal mechanism errors are investigated and hierarchical selection criteria (see TABLE 3) are established. 4. Combined point catalog (Catalog II) created, many earthquakes in it do not have focal mechanism solutions. 5. Combined point catalog (Catalog III) -- guess a focal mechanism from known solutions. 6. Combined point catalog (Catalog IV) -- a fault plane selected from using large earthquakes with extended sources, and its probability evaluated. This provisional final point catalog is also on the WEB "Combined provisional S. California catalog -- point sources". This catalog and both boxes are shown in the "Combined provisional S. California catalog -- point sources, PostScript image" diagram (see the WEB). Black beachballs -- known solutions; Orange beachballs -- guessed solutions. Earthquake focal mechanisms, m>=4.7 S. California 1800-2002 Long-term seismicity forecast for southern California We applied the technique developed by us to estimate the long-term seismicity forecast for southern California, using the earthquake catalogs shown here. We also used horizontal shear strain rate, based on the SCEC Crustal Motion Model 2.0 (Shen et al., 1996) to evaluate the long-term earthquake rate. We compare these forecasts with earthquake record 1993-2001 ("pseudo-prospective" test). REFERENCES Kagan, Y. Y., and D. D. Jackson, 1994. Long-term probabilistic forecasting of earthquakes, J. Geophys. Res., 99, 13,685-13,700. Jackson, D. D., and Y. Y. Kagan, 1999. Testable earthquake forecasts for 1999, Seism. Res. Lett., 70, 393-403. Rong, Y.-F., D. D. Jackson, and Y. Y. Kagan, 1999. Tests of Circum-Pacific seismic gap models, Eos Trans. AGU, 80(46), Fall AGU Meet. Suppl., p. F687. Kagan, Y. Y., and D. D. Jackson, 2000. Probabilistic forecasting of earthquakes, Geophys. J. Int., 143, 438-453. Kagan, Y. Y., 2002. Seismic moment distribution revisited: II. Moment conservation principle, Geophys. J. Int., 149, 731-754. Bird, P., Kagan, Y. Y., and Jackson, D. D., 2002. Plate tectonics and earthquake potential of spreading ridges and oceanic transform faults, in Plate Boundary Zones, AGU Monograph, eds. S. Stein and J. T. Freymueller, in press. Kagan, Y. Y., 2002. Modern California earthquake catalogs, their comparison, Seism. Res. Lett., in press, http://scec.ess.ucla.edu/~ykagan/calcat_index.html. Kagan, Y. Y., Y. F. Rong, and D. D. Jackson, 2002. Earthquake clustering and forecasts (Chapter 5 of the ARBUS book), in press, http://scec.ess.ucla.edu/~ykagan/arbus_index.html. Rong Y. and D. D. Jackson, 2002. Evaluation earthquake potentials in and around China: A smoothed seismicity approach, Geol. Res. Lett., in press. Figure 1. Focal mechanisms of earthquakes from the 1800-2002 catalog in Southern California area. Lower hemisphere diagrams of focal spheres are shown. Known m>= 4.7 earthquakes are shown. Symbol size is proportional to earthquake magnitude. The striped regions correspond to compression quadrants. Black symbols correspond to known solutions, orange symbols are guessed mechanisms. The polygon shows area where catalog is considered more accurate and reliable. Figure 2. Focal mechanisms of earthquakes from the 1800-2000 catalog in southern California area and major surface faults. Lower hemisphere diagrams of focal spheres are shown. Symbol size is proportional to earthquake magnitude. The striped regions correspond to compression quadrants. More densely striped “beach-balls”' correspond to point sources; extended sources are shown by a series of less striped symbols. Stripes are concentrated toward the earthquake fault plane projection to indicate the presumed fault plane. Figure 5. Long-term seismicity forecast for southern California: Latitude limits 32.0-37.0N, longitude limits 114.0-122.0W. Earthquakes after 1992/12/31 are shown in white. The size of circles is proportional to earthquake magnitude. Color scale tones show the long-term probability of earthquake occurrence calculated with the historical and Harvard 1977-1992 catalog. Figure 6. Long-term seismicity forecast for southern California: Latitude limits 32.0-37.0N, longitude limits 114.0-22.0W. Earthquakes after 1992/12/31 are shown in white. The size of circles is proportional to earthquake magnitude. Color scale tones show the long-term probability of earthquake occurrence calculated using strain map.