Download
1 / 45
450 likes | 598 Views
FLOW CYTOMETRY EDWARD F. SROUR, Ph.D. Professor of Medicine, Pediatrics, & Micro/Immunol Indiana University School of Medicine Indianapolis, IN esrour@iupui.edu . What is Flow Cytometry?.

E N D
FLOW CYTOMETRY • EDWARD F. SROUR, Ph.D. • Professor of Medicine, Pediatrics, & Micro/Immunol • Indiana University School of Medicine • Indianapolis, IN • esrour@iupui.edu
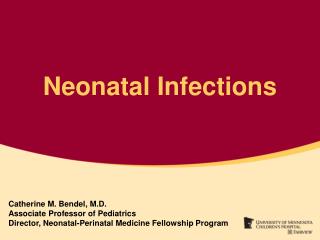
What is Flow Cytometry? • Cytometry refers to the measurement of physical/chemical characteristics of cells or other biological particles. • Flow Cytometry is the process whereby such measurements are made upon cells/particles as they pass through a measuring apparatus (hopefully in single file) suspended in a fluid stream. • Flow Sorting(Flow Cytometric Cell Sorting) extends flow cytometry with the additional capacity to divert and collect cells exhibiting an identifiable set of characteristics either mechanically or by electrical means (Flow Cytometric Analysis). • FACS - Fluorescence Activated Cell Sorting? FACS is a trademark of Becton Dickinson Immunocytometry Systems (BDIS). All FACS instruments are BDIS systems, but not all cytometers are FACS.
Injector Tip Sheath fluid Fluorescence signals Focused laser beam Flow Cell
What is Flow Cytometry? • Cytometry refers to the measurement of physical/chemical characteristics of cells or other biological particles. • Flow Cytometry is the process whereby such measurements are made upon cells/particles as they pass through a measuring apparatus (hopefully in single file) suspended in a fluid stream. • Flow Sorting(Flow Cytometric Cell Sorting) extends flow cytometry with the additional capacity to divert and collect cells exhibiting an identifiable set of characteristics either mechanically or by electrical means (Flow Cytometric Analysis). • FACS - Fluorescence Activated Cell Sorting? FACS is a trademark of Becton Dickinson Immunocytometry Systems (BDIS). All FACS instruments are BDIS systems, but not all cytometers are FACS.
+ Fluorescence Activated Cell Sorting FALS Sensor 488 nm laser Fluorescence detector - Charged Plates Single cells sorted into test tubes
What is Flow Cytometry? • Cytometry refers to the measurement of physical/chemical characteristics of cells or other biological particles. • Flow Cytometry is the process whereby such measurements are made upon cells/particles as they pass through a measuring apparatus (hopefully in single file) suspended in a fluid stream. • Flow Sorting(Flow Cytometric Cell Sorting) extends flow cytometry with the additional capacity to divert and collect cells exhibiting an identifiable set of characteristics either mechanically or by electrical means (Flow Cytometric Analysis). • FACS - Fluorescence Activated Cell Sorting? FACS is a trademark of Becton Dickinson Immunocytometry Systems (BDIS). All FACS instruments are BDIS systems, but not all cytometers are FACS.
Measurements in Flow Cytometry • Electronic Cell Volume • detect and measure the volume of particles as they pass through a small orifice • viable cells are better insulators than fixed/dead cells • Light Scatter • all objects passing through a laser beam in a cytometer will scatter light • large objects will scatter more light in the forward direction than small objects • light scatter signals are commonly used to trigger data acquisition
Measurements in Flow Cytometry • Light Scatter (continued) • Two angular regions for detecting light scatter (usually from the primary laser only in a multi-laser system) • Forward Angle Light Scatter 2° - 20° (FSC), size related biased by refractive index • Side Scatter near 90° (SSC), structure dependent - “reflective” qualities of a particle
Laser FALS Sensor Forward Angle Light Scatter
Measurements in Flow Cytometry • Light Scatter (continued) • Two angular regions for detecting light scatter (usually from the primary laser only in a multi-laser system) • Forward Angle Light Scatter 2° - 20° (FSC), size related biased by refractive index • Side Scatter near 90° (SSC), structure dependent - “reflective” qualities of a particle
Laser FALS Sensor 90LS Sensor 90 Degree Light Scatter
Spectra of Fluorochromes Dyes Used on Research Cytometers - 2 Excitation - 488nm [Argon] / 535nm [HeCad]
560nm short pass dichroic mirror 585nm band pass FL2 PMT 510nm long pass dichroic mirror 488nm band pass SSC PMT Typical 4 parameter layout 530nm band pass FL1 PMT 488nm band pass FSC 488nm laser beam PD flow cell
APC Cy5 TOTO-3 TO-PRO-3 FL 4 Half Mirror 661/16 BP 633nm SSC FACScan - FACS Calibur Examples of commonly used fluorochromes PerCP TruRed PI 1 PE-Cy5 PE-Cy7 Red613 2 Argon Laser FL 3 670 LP 488nm FITC GFP FMLP CFSE DCFH BODIPY DHR 123 TOTO-1 TO-PRO-1 Fluo-3 Calcein Alexa 488 90° light scatter “Granularity” PE Cy3 PI FL 2 610 LP 585/42 BP FL 1 560 SP 530/30 BP 1 PI is dimmer than in the FACScan (650nmLP) 2 Red613 is extremely poor with the 670LP FSC FACScan family 3 to 4 Fluorescence Detectors 2° - 16° light scatter “Size”, refractive index
The most common display formats • Histogram • single parameter only, array created • acquisition and analysis • Dot Plot • bivariate, two parameters (scattergram) • acquisition and analysis • Density Plot • bivariate, 64x64, 128x128, or 256x256 2D array • acquisition and analysis • Contour Plot • bivariate, 64x64, 128x128, or 256x256 2D array • analysis only
The most common display formats • Histogram • single parameter only, array created • acquisition and analysis • Dot Plot • bivariate, two parameters (scattergram) • acquisition and analysis • Density Plot • bivariate, 64x64, 128x128, or 256x256 2D array • acquisition and analysis • Contour Plot • bivariate, 64x64, 128x128, or 256x256 2D array • analysis only
RK-04-17-98.004 Histograms or Bivariate Displays? • Bivariate displays often provide more graphical information
Dot Plot acquisition rare events Density Plot showing distributions relative numbers of events Contour Plot showing populations relative numbers of events Dot/Density/Contour RK-04-17-98.004
Light Scatter Gating Side Scatter Projection Neutrophils Scale 1000 200 100 50 40 Monocytes 30 20 15 Lymphocytes 8 200 400 600 800 1000 0 90 Degree Scatter
Immunophenotyping 100 1000 10 1 .1 Log FITC
CD # = cluster designation number Immunophenotyping CD2 CD4
G0 G1 G2 M 4N 2N Normal Cell Cycle M G0 G2 DNA Analysis G1 s Count s 0 200 400 600 800 1000 DNA content
DNA Analysis 0 200 400 600 800 1000 4N 2N PI Fluorescence
Stimulation 108 0 36 72 144 180 Time (Seconds) Calcium Flux - Indo-1
Uses for Multiple Fluorescence Parameters • Phenotyping (Cell Surface Antigens) • 168 CD Cell Surface Antigens • Many functional populations require 5 or more surface markers to be fully distinguished • Functional Assays • Cell Cycle (PI, BrdU, Intracellular Cyclins) • Apoptosis (AnexinV, Active Caspase-3) • Ca++ Flux [Indo-1, Fura] • Cytokine Production • Intracellular Signaling (Rb phosphorylation) • Gene Reporter [Molecular] Assays • GFP, BFP, YFP, NFP Expression • LacZ Expression
Advantages/ Disadvantages of Using More Colors • Advantages • Save Time, Reagents, Samples- • (1) 6-color stain = (15) 2-color stains • Exponential increase in information • Data from (1) 6-color stain » (15) 2-color stains • identify new/rare population (<0.05%) • internal controls • Problems • Must carefully choose combinations of fluorochrome conjugates • All reagents not available in all colors • Greater potential for errors in compensation • Proper controls required
What other information can be collected from immunofluorescence?
Examples - histogram Geometric mean/median Arithmetic mean Geometric mean: 281.88 Arithmetic mean: 455.80 Median: 283.87
B A C R2 R3 D E R2
Tau DAPI IUSM
Mean/Median - histogram example Marker Mean Median Gmean M1 18.0 13.0 15.0 M2 976.0 583.0 626.0
diff amps log amps amplified signals PMT’s pulses linear amps PD signal processing computer sort module Cytometer signal pathsimplified 2 color example lens Cell Cytometer
Flow Cytometry versus Flow Activated Cell Sorting (FACS)