Download

1 / 68
680 likes | 848 Views
Nutrients as Pollutants. Major Determinants of Water Quality and the Impact or Availability of Water Pollutants. Organisms Solubility Oxygen pH. Nutrients (N, P) Metals (Hg, Pb, As) Organic Chemicals (PCBs, Dioxins). Nutrients: Nitrogen and Phosphorus. Nutrients: Nitrogen and Phosphorus.

E N D
Major Determinants of Water Quality and the Impact or Availability of Water Pollutants Organisms Solubility Oxygen pH Nutrients (N, P) Metals (Hg, Pb, As) Organic Chemicals (PCBs, Dioxins)
Nutrients: Nitrogen and Phosphorus Sources: fertilizers, manures, wastewater discharge Availability in the environment is controlled by Oxygen pH Organisms Both are limiting to primary productivity Excess amounts can severely alter ecosystems
Nutrient Additions Photosynthetic life O2 Eutrophication Nutrient addition increases primary productivity (algae) Sunlight is limited at greater depth Photoautotrophs die and become food for aerobic heterotrophs Aerobic autotrophs consume O2 Oxygen content in water is reduced bacteria If oxygen is reduced sufficiently, aerobic microbes cannot survive, and anaerobic microbes take over
Nitrogen NH4+ and NO3- Forms are controlled by organisms NH4+ is converted to NO3- by aerobic bacteria The process is called nitrification These bacteria, therefore, are controlled by oxygen levels Nitrifying bacteria do not function well at low pH. Organisms Oxygen pH
Dominant Forms: NH4+ and NO3- Sources: fertilizers, manures, wastewater discharge NO3- is more mobile in the environment than NH4+ NH4+ _ _ _ _ _ _ NO3- _ _ _ Soil particles possess a negative electrical charge Leaching to ground Or surface water
Groundwater and Nitrates (NO3-) Nitrates do not interact significantly with soil material and can move rapidly to groundwater. What areas are particularly vulnerable? 1. The unconfined, surficial aquifer 2. Areas where natural groundwater recharge occurs 3. Areas where the aquifer confining unit is thin are also particularly vulnerable.
Unconfined Aquifers Sandy Materials Unconfined aquifer is extensive throughout the state of Florida Low Permeability Confining Unit (poor water movement) Miocene Clays (Hawthorne Formation) The Floridan aquifer is a confined aquifer. The water-bearing unit is permeable limestone. 55 – 24 million years ago Low permeability rock (confining)
Where the Confining Layer is Thin Groundwater Thin sandy overburden
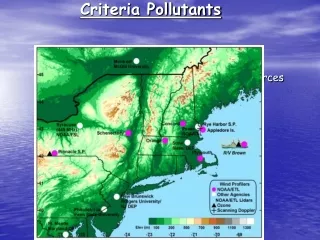
Lower Suwannee River Watershed • residential and commercial septic systems in rural areas • about 300 row crop and vegetable farms • 44 dairieswith more than 25,000 animals • 150 poultryoperations with more than 38 million birds Nitrates NO3 Drinking water standard: 10 ppm
Environmental and Health Hazard Methemoglobinemia Nitrate is converted to nitrite in infants (pH, organisms) Nitrite converts iron in the hemoglobin of red blood cells to form methemoglobin which cannot bind oxygen Adults possess an enzyme that reverses the conversion Infants possess 60% less of the enzyme
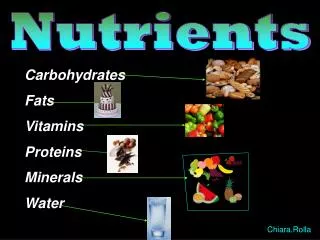
Phosphorus Present in Fertilizers, animal wastes, wastewater Limiting Element to Primary Productivity Chlorophyll ATP Phospholipids Additions increase Productivity ATP
Fertility Most phosphorus is unavailable to plants Only 10-15% of applied fertilizer phosphorous is used by plants The rest is bound to soil particles or forms insoluble solids This leads to excess application
Plant Availablity and pH Most Available H2PO4- HPO4-2 pH 6-8 pH 3-6 pH 8-11 Optimum pH = 6.5 for plant availability
Binding of Phosphorus Low pH High pH Aluminum and Iron phosphates Calcium Phosphates Formation of Insoluble solids Reaction with soil particles There is a finite capacity to immobilize phosphorus If the capacity is exceeded, phosphorus becomes more mobile Mobile phosphorus can contaminate surface and groundwater
Unimpacted P-impacted *
Phosphorus loading to S. Florida Ecosystem Dairy/Beef Inputs North and South of Okeechobee Crop production
Crops: Everglades Agricultural Area EAA Sugar, Rice, Veg. 700,000 ac
Phosphorus Fertilization (lbs/ac) Based on how much P is already in soils V. High Soil P Low Soil P
Phosphorus loading to S. Florida Ecosystem Agriculture Overstimulation of primary productivity
Kissimmee drainage basin 12,000 km2 Dairy and Beef In 1521 Ponce de Leon brought horses and cattle to Florida. (1947) No other part of our country had cattle until the Pilgrims brought cattle in the early 1600's Florida's ranchers now raise the third largest number of cattle of any state east of the Mississippi
Phosphorus Solid Manure: 5.5 g / kg total Phosphorus One cow can excrete between 40 and 60 g of phosphorus per day Subject to movement via runoff, stream flow, soil water movement, and groundwater movement
Cattle and Dairy Okeechobee, Highlands, and Glades Counties: 328,000 head (19% of total) Okeechobee County is ranked number one for all cattle in the state
Kissimmee – Okeechobee - Everglades The Lower Kissimmee River Basin is among largest sources of external phosphorus loading to Lake Okeechobee The Kissimmee river alone contributes about 20% of the phosphorus flowing into Lake Okeechobee urban Okeechobee, in turn, is a source of phosphorus to the Everglades
Surface Water Improvement Management Act: SWIM Mandated phosphorus load level of 397 tons/yr urban Clean Water act: 154.3 tons per year DEP: 140 tons per year SWIM Plan priority basins Lake Target level of 40 ppb in Lake Okeechobee
Some Strategies The Dairy Rule (1987) creating lagoons to capture and contain dairy waste Implement Best Management Practices (BMPs) buffer areas around places animals congregate, eliminating phosphorus fertilization near tributaries to the lake, reducing phosphorus imports in animal feeds, reducing animal density Works of the District Rule permits are required for all discharges into waterways Dairy Buy-Out Program to facilitate removal of animals from dairies not able to comply 19 of 45 Dairies Remain
2007: 146 ton reduction of P entering Okeechobee From a baseline of 433 tons/yr The target level is 40 ppb. Phosphorus concentrations in the Lake remain at about 117 ppb
Internal Loading Two Sources Decomposition of submerged aquatic vegetation releasing phosphorus back into the water column Dissolution of Iron and Aluminum compounds in sediments which bind and store phosphorus.
Internal Loading Phosphorus and Iron Phosphorus has a strong affinity for iron FePO4 Solid Precipitate Readily incorporates into bottom sediments
Iron Exists in Two Different Forms Depending on Oxygen Content Fe3+ high oxygen Fe2+ low oxygen Phosphorus compounds become soluble Forms insoluble solids with Phosphate Fe3+ + PO43- = FePO4 solid
Internal Loading Fe3+ high oxygen Fe2+ low oxygen Dissolved phosphorus combines with oxidized iron (Fe3+) to create an insoluble compound that becomes buried in lake sediments. Fe3+ + PO43- = Fe(PO4) Simplified: solid If oxygen contents are reduced (anoxic bottom sediments) the Fe3+ converts to Fe2+ which solubilizes the compound returning P to water. 2+ 3- Fe (PO4) to water P released by sediments is taken up by photosynthetic algae faster than it can be returned to the sediments
Lake Okeechobee Action Plan Developed by the Lake Okeechobee Issue Team December 6, 1999 RECOMMENDATION – Control Internal Phosphorus Loading. Phosphorus-rich mud sediments need to be removed from the lake to the maximum extent that is practical, in order to reduce internal phosphorus loading. Unless this internal loading is substantially reduced, it may take as long as 100 years for the lake to respond to watershed phosphorus control programs.
Chemical Pollutants Metals and Non-metals
Mercury, Arsenic, and Lead Lead found in blood sample from 1 of 10 Washingtonians Arsenic found in urine samples from 4 of 10 Washingtonians Mercury found in hair samples from 10 of 10 Washingtonians
Wonderland Mercury Nitrate Symptoms included tremors, emotional instability, insomnia, dementia and hallucinations
Natural Groundwater Contaminants Fluoride and Arsenic
India Failure of 246 surface water quality projects 21 million backyard tube wells $600 electric pumps (1% of GDP) 95 % water tables falling by 20 feet per year What do you do when your water table falls?
Deeper Wells and Fluoride Naturally occurring element in Granite which dissolves into the groundwater Water near the surface is generally unaffected Lowering water tables = deeper wells Deep wells can penetrate granite with high fluoride levels Fluoride in water can be a cumulative poison What’s the obvious question?
Intentional Fluoridation of Water in the U.S. Fluoridation became an official policy of the U.S. Public Health Service in 1951. By 1960 water fluoridation had become widely used in the U.S. reaching about 50 million people. By 2006, 69.2% of the U.S. population on public water systems were receiving fluoridated water.
How does it work? Tooth enamel is made of a mineral called hydroxyapatite Ca5(PO4)3OH Bacteria in the mouth create acids (H+) Hydroxyapatite is subject to dissolution by acids (H+) Fluoridation changes the chemical composition of hydroxyapatite to a crystal less subject to acid dissolution
NaF Na+ + F- Sodium fluorosilicate (Na2SiF6) Sodium fluoride (NaF) Ingestion of fluoridated water increases the F- concentration in saliva F- replaces OH in hydroxyapatite making fluoroapatite F- Ca5(PO4)3 OH Fluoroapatite is less soluble in acid than hydroxyapatite
Fluoride concentrations In U.S. tap water 0.5 – 1.0 mg/L Lower values in warm climates