Download
1 / 2
20 likes | 131 Views
Understanding Intermodel Variability in the Response of Global-Mean Precipitation to CO 2 Forcing. Anthony M. DeAngelis 1 , Xin Qu 1 , Alex Hall 1 , Stephen A. Klein 2 1 Department of Atmospheric and Oceanic Sciences, University of California, Los Angeles, CA

E N D
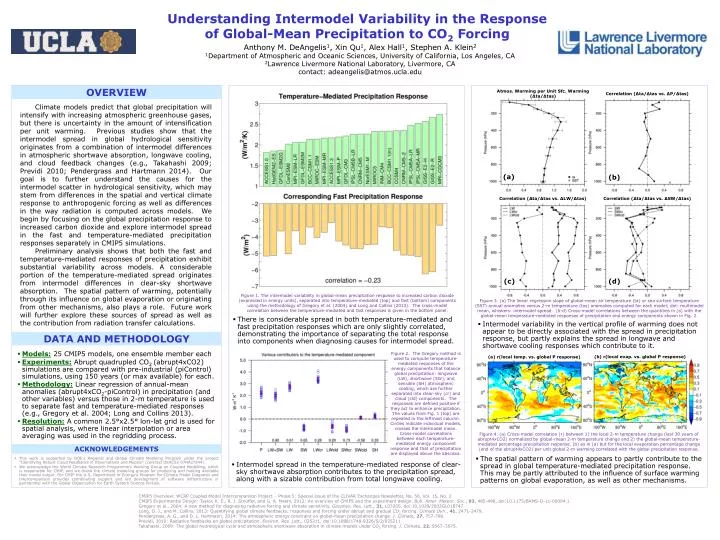
Understanding Intermodel Variability in the Response of Global-Mean Precipitation to CO2Forcing Anthony M. DeAngelis1, Xin Qu1, Alex Hall1, Stephen A. Klein2 1Department of Atmospheric and Oceanic Sciences, University of California, Los Angeles, CA 2Lawrence Livermore National Laboratory, Livermore, CA contact: adeangelis@atmos.ucla.edu OVERVIEW Atmos. Warming per Unit Sfc. Warming (Δta/Δtas) Correlation (Δta/Δtas vs. ΔP/Δtas) Climate models predict that global precipitation will intensify with increasing atmospheric greenhouse gases, but there is uncertainty in the amount of intensification per unit warming. Previous studies show that the intermodel spread in global hydrological sensitivity originates from a combination of intermodel differences in atmospheric shortwave absorption, longwave cooling, and cloud feedback changes (e.g., Takahashi 2009; Previdi 2010; Pendergrass and Hartmann 2014). Our goal is to further understand the causes for the intermodel scatter in hydrological sensitivity, which may stem from differences in the spatial and vertical climate response to anthropogenic forcing as well as differences in the way radiation is computed across models. We begin by focusing on the global precipitation response to increased carbon dioxide and explore intermodel spread in the fast and temperature-mediated precipitation responses separately in CMIP5 simulations. Preliminary analysis shows that both the fast and temperature-mediated responses of precipitation exhibit substantial variability across models. A considerable portion of the temperature-mediated spread originates from intermodel differences in clear-sky shortwave absorption. The spatial pattern of warming, potentially through its influence on global evaporation or originating from other mechanisms, also plays a role. Future work will further explore these sources of spread as well as the contribution from radiation transfer calculations. (a) (b) Correlation (Δta/Δtas vs. ΔLW/Δtas) Correlation (Δta/Δtas vs. ΔSW/Δtas) (d) (c) Figure 1. The intermodel variability in global-mean precipitation response to increased carbon dioxide (expressed in energy units), separated into temperature-mediated (top) and fast (bottom) components using the methodology of Gregory et al. (2004) and Long and Collins (2013). The cross-model correlation between the temperature-mediated and fast responses is given in the bottom panel. Figure 3. (a) The linear regression slope of global-mean air temperature (ta) or sea surface temperature (SST) annual anomalies versus 2-m temperature (tas) anomalies computed for each model; dot: multimodel mean, whiskers: intermodel spread. (b-d) Cross-model correlations between the quantities in (a) with the global-mean temperature-mediated responses of precipitation and energy components shown in Fig. 2. • There is considerable spread in both temperature-mediated and fast precipitation responses which are only slightly correlated, demonstrating the importance of separating the total response into components when diagnosing causes for intermodel spread. • Intermodel variability in the vertical profile of warming does not appear to be directly associated with the spread in precipitation response, but partly explains the spread in longwave and shortwave cooling responses which contribute to it. DATA AND METHODOLOGY • Models:25 CMIP5 models, one ensemble member each • Experiments:Abrupt quadrupled CO2 (abrupt4xCO2) simulations are compared with pre-industrial (piControl) simulations, using 150 years (or max available) for each. • Methodology:Linear regression of annual-mean anomalies (abrupt4xCO2-piControl) in precipitation (and other variables) versus those in 2-m temperature is used to separate fast and temperature-mediated responses (e.g., Gregory et al. 2004; Long and Collins 2013). • Resolution:A common 2.5°x2.5° lon-lat grid is used for spatial analysis, where linear interpolation or area averaging was used in the regridding process. Figure 2. The Gregory method is used to compute temperature-mediated responses of the energy components that balance global precipitation: longwave (LW), shortwave (SW), and sensible (SH) atmospheric cooling, which are further separated into clear-sky (cr) and cloud (cld) components. The responses are defined positive if they act to enhance precipitation. The values from Fig. 1 (top) are repeated in the leftmost column. Circles indicate individual models, crosses the intermodel mean. Cross-model correlations between each temperature-mediated energy component response and that of precipitation are displayed above the abscissa. (b) r(local evap. vs. global P response) (a) r(local temp. vs. global P response) Figure 4. (a) Cross-model correlation (r) between 1) the local 2-m temperature change (last 30 years of abrupt4xCO2) normalized by global-mean 2-m temperature change and 2) the global-mean temperature-mediated percentage precipitation response. (b) as in (a) but for the local evaporation percentage change (end of the abrupt4xCO2) per unit global 2-m warming correlated with the global precipitation response. ACKNOWLEDGEMENTS • The spatial pattern of warming appears to partly contribute to the spread in global temperature-mediated precipitation response. This may be partly attributed to the influence of surface warming patterns on global evaporation, as well as other mechanisms. • This work is supported by DOE’s Regional and Global Climate Modeling Program under the project ‘‘Identifying Robust Cloud Feedbacks in Observations and Models’’ (contract DEAC52-07NA27344). • We acknowledge the World Climate Research Programme's Working Group on Coupled Modelling, which is responsible for CMIP, and we thank the climate modeling groups for producing and making available their model output. For CMIP the U.S. Department of Energy's Program for Climate Model Diagnosis and Intercomparison provides coordinating support and led development of software infrastructure in partnership with the Global Organization for Earth System Science Portals. • Intermodel spread in the temperature-mediated response of clear-sky shortwave absorption contributes to the precipitation spread, along with a sizable contribution from total longwave cooling. CMIP5 Overview: WCRP Coupled Model Intercomparison Project – Phase 5: Special Issue of the CLIVAR Exchanges Newsletter, No. 56, Vol. 15, No. 2 CMIP5 Experimental Design: Taylor, K. E., R. J. Stouffer, and G. A. Meehl, 2012: An overview of CMIP5 and the experiment design. Bull. Amer. Meteor. Soc., 93, 485-498, doi:10.1175/BAMS-D-11-00094.1. Gregory et al., 2004: A new method for diagnosing radiative forcing and climate sensitivity. Geophys. Res. Lett., 31, L03205, doi:10.1029/2003GL018747. Long, D. J., and M. Collins, 2013: Quantifying global climate feedbacks, responses and forcing under abrupt and gradual CO2forcing. Climate Dyn., 41, 2471-2479. Pendergrass, A. G., and D. L. Hartmann, 2014: The atmospheric energy constraint on global-mean precipitation change. J. Climate, 27, 757-768. Previdi, 2010: Radiative feedbacks on global precipitation. Environ. Res. Lett., 025211, doi:10.1088/1748-9326/5/2/025211. Takahashi, 2009: The global hydrological cycle and atmospheric shortwave absorption in climate models under CO2 forcing. J. Climate, 22, 5667–5675.
List of the CMIP5 models used for analysis. The approximate spatial resolutions were calculated by dividing 360° or 180° by the number of grid cells in the longitude or latitude dimensions, respectively. The first ensemble member run was used from each model. * Indicates the model grids that were transformed to the common 2.5°x2.5° lon-lat resolution using linear interpolation due the coarse native grid. All others were transformed using area averaging.