Download
1 / 14
140 likes | 261 Views
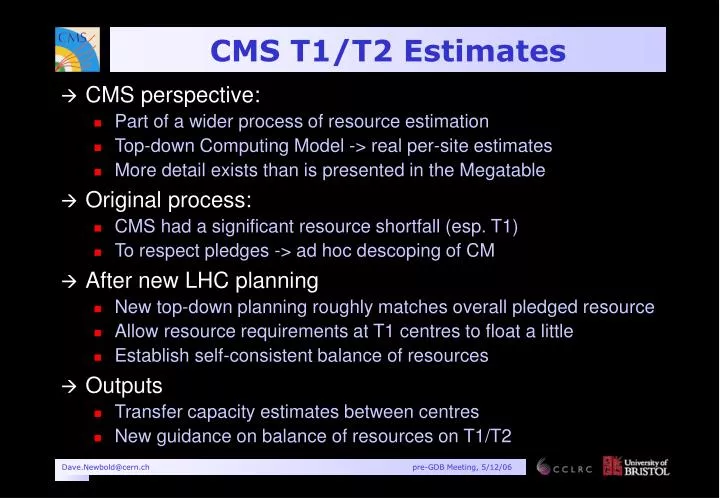
CMS T1/T2 Estimates. CMS perspective: Part of a wider process of resource estimation Top-down Computing Model -> real per-site estimates More detail exists than is presented in the Megatable Original process: CMS had a significant resource shortfall (esp. T1)

E N D
CMS T1/T2 Estimates • CMS perspective: • Part of a wider process of resource estimation • Top-down Computing Model -> real per-site estimates • More detail exists than is presented in the Megatable • Original process: • CMS had a significant resource shortfall (esp. T1) • To respect pledges -> ad hoc descoping of CM • After new LHC planning • New top-down planning roughly matches overall pledged resource • Allow resource requirements at T1 centres to float a little • Establish self-consistent balance of resources • Outputs • Transfer capacity estimates between centres • New guidance on balance of resources on T1/T2 Dave.Newbold@cern.ch pre-GDB Meeting, 5/12/06
Inputs: CMS Model • Data rates, event sizes • Trigger rate: ~300Hz (450MB/s) • Sim to real ratio is 1:1 (though not all full simulation) • RAW (sim) 1.5 (2.0) MB/evt; RECO (sim) 250 (400) kB/evt • All AOD is 50kB/evt • Data placement • RAW/RECO: one copy across all T1, disk1tape1 • Sim RAW/RECO: one copy across all T1, on tape with 10% disk cache • How is this expressed in diskXtapeY formalism? • Is this formalism in fact appropriate for resource questions…? • AOD: one copy at each T1, disk1tape1 Dave.Newbold@cern.ch pre-GDB Meeting, 5/12/06
Inputs: LHC, Centres • 2008 LHC assumptions • 92 days of ‘running’ (does not include long MD periods) • 50% efficiency during ‘running’ • Practical implication: the T0 is 100% busy for this time • Input smoothing at T0 required; assume queue < few days • T0 output rate is flat during ‘running’ (straight from T0 capacity) • More precise input welcomed + would be useful • Not expected to have strong effects upon most of the estimates • Efficiencies, overheads, etc • Assume 70% T1/T2 disk fill factor (the 30% included in expt reqt) • Assume 100% tape fill factor (i.e. any overhead owned by centre) • T1 CPU efficiency back to 75 / 85% (chaotic/shed) Dave.Newbold@cern.ch pre-GDB Meeting, 5/12/06
Centre Roles: T1 • T1 storage reqts: • Curation of assigned fraction of RAW • Assigned raw data fractions 1st fundamental input to T1/T2 process • Storage of corresponding RECO / MC from associated T2 centres • Association of T1/T2 2nd fundamental input to T1/T2 process • Hosting of entire AOD • T1 processing reqts: • Re-reconstruction: RAW -> RECO -> AOD • Skimming; group and end-user bulk analysis of all data tiers • Calibration, alignment, detectors studies, etc • T1 connections • T0 -> T1: Prompt RAW/RECO from T0 (to tape) • T1 <->T1: Replication of new AOD version / hot data • T1 -> T2; T2 -> T1 (see below) Dave.Newbold@cern.ch pre-GDB Meeting, 5/12/06
Centre Roles: T2 • T2 storage reqts: • Caching of T1 data for analysis; no custodial function • Working space for analysis groups, MC production • T2 processing reqts: • Analysis / MC production only • Assume ratio of analysis:MC constant across T2 • T1 -> T2 dataflow: • AOD: comes from any T1 in principle, often from associated T1 • For centres without ‘local’ T1, can usefully share the load • RECO: must come from defined T1 with that sample • Implies full T1 -> T2 many-to-many interconnection • Natural consequence of storage-efficient computing model • T2 -> T1 dataflow: • MC data always goes to associated T1 Dave.Newbold@cern.ch pre-GDB Meeting, 5/12/06
T1/T2 Associations • NB: These are working assumptions in some cases • Stream “allocation” ~ available storage at centre Dave.Newbold@cern.ch pre-GDB Meeting, 5/12/06
Centre Roles: CERN CAF / T1 • CAF functionality • Provides short-latency analysis centre for critical tasks • e.g. detector studies, DQM, express analysis, etc • All data available in principle • T1 functionality • CERN will act as associated T1 for RDMS / Ukraine T2 • Note: not a full T1 load, since no T1 processing, no RECO serving • There is the possibility to carry out more general T1 functions • e.g. second source of some RECO in case of overload • Reserve this T1 functionality to ensure flexibility • Same spirit as the CAF concept • CERN non-T0 connections • Specific CERN -> T2 connection to associated centres • Generic CERN -> T2 connection for service of unique MC data, etc • T1 <-> CERN connection for new-AOD exchange Dave.Newbold@cern.ch pre-GDB Meeting, 5/12/06
Transfer Rates • Calculating data flows • T0->T1: data rates, running period • Rate is constant during running, zero otherwise • T1<->T1; total AOD size, replication period (currently 14 days) • High rate, short duty cycle (so OPN capacity can be shared) • Short repl. period driven by disk reqd for multiple AOD copies • T1->T2: T2 capacity; refresh period at T2 (currently 30 days) • This gives the average rate only - not a realistic use pattern • T2->T1: total MC per centre per year • Peak versus average (T1 -> T2) • Worst-case peak for T1 is sum of T2 transfer capacities • Weighted by data fraction at T1 • Realistically, aim for: average_rate < T1_capacity < peak_rate • Difference between peak / avg is uniformly a factor 3-4 • Better information on T2 connection speeds will be needed Dave.Newbold@cern.ch pre-GDB Meeting, 5/12/06
Outputs: Rates • Units are MB/s • These are raw rates: no catchup (x2?), no overhead (x2?) • Potentially some large factor to be added • A common understanding is needed • FNAL T2-out-avg is around 50% US, 50% external Dave.Newbold@cern.ch pre-GDB Meeting, 5/12/06
Outputs: Capacities • “Resource” from a simple estimate of relative unit costs • CPU : Disk : Tape at 0.5 : 1.5 : 0.3 (a la B. Panzer) • Clearly some fine-tuning left to do • But is a step towards a reasonably balanced model • Total is consistent with top-down input to CRRB, by construction • Storage classes are still under study • Megatable totals are firm, but diskXtapeY categories are not • This may be site-dependent (also, details of cache) Dave.Newbold@cern.ch pre-GDB Meeting, 5/12/06
e.g. RAL Storage Planning Dave.Newbold@cern.ch pre-GDB Meeting, 5/12/06
Comments / Next Steps? • T1 / T2 process: • Has been productive and useful; exposed many issues • What other information is useful for sites? • Internal dataflow estimates for centres (-> cache sizes, etc) • Assumptions on storage classes, etc. • Similar model estimates for 2007 / 2009+ • Documentation of assumed CPU capacities at centres • What does CMS need? • Feedback from sites (not overloaded with this so far) • Understanding of site ramp-up plans, resource balance, network capacity • Input on realistic LHC schedule, running conditions, etc • Feedback from providers on network requirements • Goal: detailed self-consistent model for 2007/8 • Based upon real / guaranteed centre, network capacities… • Gives at least an outline for ramp-up at sites, global experiment • Much work left to do… Dave.Newbold@cern.ch pre-GDB Meeting, 5/12/06
Backup: Rate Details Dave.Newbold@cern.ch pre-GDB Meeting, 5/12/06
Backup: Capacity Details Dave.Newbold@cern.ch pre-GDB Meeting, 5/12/06