Download
1 / 57
570 likes | 653 Views
15: Detection & Attribution of Climate Signals. Involves statistical analysis and the careful assessment of multiple lines of evidence to demonstrate, within a pre-specified margin of error, that the observed changes are: *unlikely to be due entirely to internal variability;

E N D
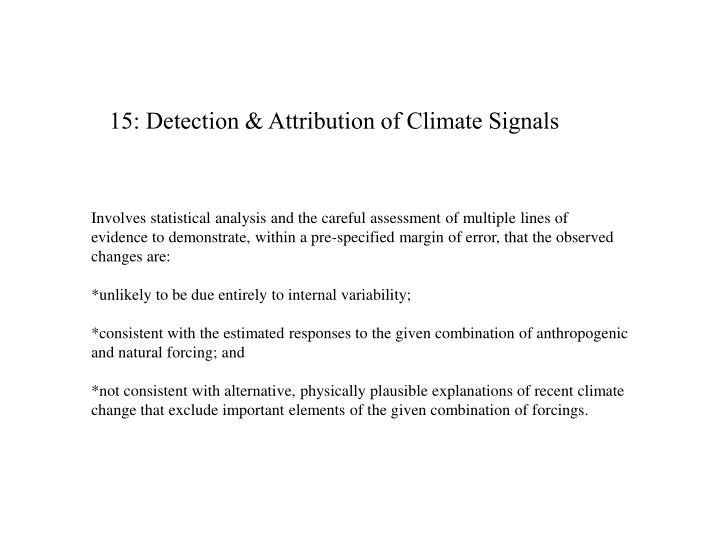
15: Detection & Attribution of Climate Signals Involves statistical analysis and the careful assessment of multiple lines of evidence to demonstrate, within a pre-specified margin of error, that the observed changes are: *unlikely to be due entirely to internal variability; *consistent with the estimated responses to the given combination of anthropogenic and natural forcing; and *not consistent with alternative, physically plausible explanations of recent climate change that exclude important elements of the given combination of forcings.
Figure 12.1: Global mean surface air temperature anomalies from 1,000-year control simulations with three different climate models, HadCM2, GFDL R15 and ECHAM3/LSG (labelled HAM3L), compared to the recent instrumental record (Stouffer et al., 2000). No model control simulation shows a trend in surface air temperature as large as the observed trend. If internal variability is correct in these models, the recent warming is likely not due to variability produced within the climate system alone.
GLOBAL AVERAGE CASE Red Noise Spectrum
NOISE FORCING WITH GEOGRAPHY&SEASONALITY • N(r, t) is peaked in Winter Midlatitudes
VARIANCE DISTRIBUTION IN THE 2MON - 10YR BAND DATA EBCM
VARIANCE DISTRIBUTION FOR THE 2 MON -- 1YR BAND DATA EBCM
data ebcm gfdl mpi SPATIAL CORRELATION LENGTHS
Computations with EBCMs (North & Kim, 1993)
Four Forcings of Climate: S: Solar Variability V: Volcanic Dust Veils G: Greenhouse Gases A: Tropospheric Aerosols (Stevens, 1998)
LINEAR RESPONSES TO FORCINGS Anthropogenic G&A (Uses Linear 2D EBCM of Stevens) (Stevens, 1998) Add Solar Add Volcanic 1900 2000
Technique & Assumptions • Linear Superpostion: • Tdata(t)=SsasSs(t)+N(t); s=G, A, V, S • EOF Expansion of all Fields • F(t)= Sn fn EOFn(t), fn statistically independent • CycloStationary EOFs along Time Axis m(t)=m(t+h); Cov (t, t’)=Cov(t+h, t’+h) NEW to this STUDY
S V A G (STEVENS, 1998)
Summary of Procedure • 1. Signals Patterns Come from Models • We use a variety, but mostly our EBCM • 2. Multiple Regression Procedure, EXCEPT: • All Covariance Matrices Come from Control Runs • We use a Variety of Models for Natural Variability, End-to-End, then compare for Robustness • Note: Using Control Runs for Natural Variability does not bias the Estimates, but Could Influence Confidence Volumes
Data Aggregation • GLOBAL AVERAGES (Jones Data Set) • MONTHLY AVERAGES • Retain Seasonality • 1944-1994, 1894-1994 Records THIS STUDY
EXAMPLES of SIGNALS:SIGNAL FOR SOLAR VARIABILITY • SOLAR IRRADIANCE VS SUNSPOT NUMBER • SUNSPOTS IN HISTORY • GEOGRAPHICAL RESPONSE TO 11YR CYCLE
http://science.msfc.nasa.gov/ssl/pad/solar/images/sunturn.gifhttp://science.msfc.nasa.gov/ssl/pad/solar/images/sunturn.gif
http://science.msfc.nasa.gov/ssl/pad/solar/images/sunspot1.jpghttp://science.msfc.nasa.gov/ssl/pad/solar/images/sunspot1.jpg SUNSPOT T~3700K T~5700K GRANULES GRANULES ~ 1000KM
AMP ~0.1% SOLAR IRRADIANCE VS TIME OVER TWO DECADES
SOLAR IRRADIANCE AS ESTIMATED FROM SUNSPOT DATA (STEVENS, 1998)
RESPONSE TO SOLAR FORCING WITH PERIOD 10 YEARS (Stevens’ EBCM)
GREENHOUSE & AEROSOLSIGNALS • GEOGRAPHICAL & TEMPORAL SHAPE OF G • SPACE-TIME SHAPE OF A
DISTRIBUTION OF AEROSOLS USED (STEVENS, 1998)
Modeling the Signal • Can the EBCM be used? • Comparison with Hadley & Max Planck • Global and Smaller Scale Simulation of GH Warming Signal over the Last Century
WHY INCLUDE SEASONS? Variance Variance SEASONAL CYCLE OF Natural Variability & Aerosol Forcing Amplitude JAN DEC
ANALYSIS OF MODAL CONTRIBUTIONS FRACTION OF SIGNAL2 CAPTURED BY TRUNCATED EXPANSION SEASONS RETAINED ANNUAL ONLY NUMBER OF EOF MODES RETAINED ->
ANALYSIS OF EOF MODAL CONTRIBUTIONS, CONTINUED GREENHOUSE GAS SIGNAL (G) IMPROVEMENT DUE TO SEASONAL SNR2 LESSONS: ESTIMATE STABILIZES SEASONS IMPROVE SNR AMPLITUDE OF G (ESTIMATE) EOF MODES RETAINED -->.
Volcanic Solar A G SIGNAL2 Frac Sig2 captured RESULTS from 101 yr Set EOF Eig. Val. EIGENVALUE snr from Indiv EOF INDIVIDUAL MODE SNR2 CUMULATIVE SNR2 G Amp Est. A modes retained
S V VOLCANIC AND SOLAR SIGNALS snr>2
Solar Cycle SNR2 and Amplitude Estimate seasonal annual DETECTION!
Monte Carlo Study with 200 50 Year Simulations Illustrating the Correlation between Estimates of G and A. Dashed: 95% CI for Annual data, Solid: Seasonal Est. of A NOTE: The Diagram for Solar is Circular (not shown) Est. of G
LAST 50 YRS LAST 100 YRS 95% CONFIDENCE REGIONS FOR S vs G, A, V
ebcm signal G Robustness of Results across Models Used G in EBCM A ebcm G A in EBCM uk GA G in Had2 uk GA in Had2 note: G G=G+GA mpi G in Had3CM A=GA GA mpi GA in Had3CM model used for variability
OPTIMAL FIT TO OBSERVATIONAL DATA
DETECTION CONCLUSIONS(Qigang Wu & G. North, 2002) • G, A,V, S are All Significant at 5% Level • G, A,V are All Slightly Smaller than Expected • S is Now Detected at 95% Level of Confidence and is Useful as a Test of CMs • Including Seasons Improves Performance
Figure 12.3: Latitude-month plot of radiative forcing and model equilibrium response for surface temperature. (a) Radiative forcing (Wm-2) due to increased sulphate aerosol loading at the time of CO2 doubling. (b) Change in temperature due to the increase in aerosol loading. (c) Change in temperature due to CO2 doubling. Note that the patterns of radiative forcing and temperature response are quite different in (a) and (b), but that the patterns of large-scale temperature responses to different forcings are similar in (b) and (c). The experi-ments used to compute these fields are described by Reader and Boer (1998).
Figure 12.4: (a) Observed microwave sounding unit (MSU) global mean temperature in the lower strato sphere, shown as dashed line, for channel 4 for the period 1979 to 97 compared with the average of several atmosphere-ocean GCM simulations starting with different atmospheric conditions in 1979 (solid line). The simulations have been forced with increasing greenhouse gases, direct and indirect forcing by sulphate aerosols and tropospheric ozone forcing, and Mt. Pinatubo volcanic aerosol and stratospheric ozone variations. The model simula-tion does not include volcanic forcing due to El Chichon in 1982, so it does not show stratospheric warming then. (b) As for (a), except for 2LT temperature retrievals in the lower troposphere. Note the steady response in the stratosphere, apart from the volcanic warm periods, and the large variability in the lower troposphere (from Bengtsson et al., 1999).
Figure 12.5: (a) Response (covariance, normalised by the variance of radiance fluctuations) of zonally averaged annual mean atmospheric temperature to solar forcing for two simulations with ECHAM3/LSG. Coloured regions indicate locally significant response to solar forcing. (b) Zonal mean of the first EOF of greenhouse gas-induced temperature change simulated with the same model (from Cubasch et al., 1997). This indicates that for ECHAM3/LSG, the zonal mean temperature response to greenhouse gas and solar forcing are quite different in the stratosphere but similar in the troposphere.
Figure 12.6: (a) Five-year running mean Northern Hemisphere temperature anomalies since 1850 (relative to the 1880 to 1920 mean) from an energy-balance model forced by Dust Veil volcanic index and Lean et al. (1995) solar index (see Free and Robock, 1999). Two values of climate sensitivity to doubling CO2 were used; 3.0°C (thin solid line), and 1.5°C (dashed line). Also shown are the instrumental record (thick red line) and a reconstruction of temperatures from proxy records (crosses, from Mann et al., 1998). The size of both the forcings and the proxy temperature variations are subject to large uncertainties. Note that the Mann temperatures do not include data after 1980 and do not show the large observed warming then. (b) As for (a) but for simulations with volcanic, solar and anthropogenic forcing (greenhouse gases and direct and indirect effects of tropospheric aerosols). The net anthropogenic forcing at 1990 relative to 1760 was 1.3 Wm-2 , including a net cooling of 1.3 Wm-2 due to aerosol effects.
Figure 12.7:Global mean surface temperature anomalies relative to the 1880 to 1920 mean from the instrumental record compared with ensembles of four simulations with a coupled ocean-atmosphere climate model (from Stott et al., 2000b; Tett et al., 2000) forced (a) with solar and volcanic forcing only, (b) with anthropogenic forcing including well mixed greenhouse gases, changes in stratospheric and tropospheric ozone and the direct and indirect effects of sulphate aerosols, and (c) with all forcings, both natural and anthropogenic. The thick line shows the instrumental data while the thin lines show the individual model simulations in the ensemble of four members. Note that the data are annual mean values. The model data are only sampled at the locations where there are observations. The changes in sulphate aerosol are calculated interactively, and changes in tropospheric ozone were calculated offline using a chemical transport model. Changes in cloud brightness (the first indirect effect of sulphate aerosols) were calculated by an offline simulation (Jones et al., 1999) and included in the model. The changes in stratospheric ozone were based on observations. The volcanic forcing was based on the data of Sato et al. (1993) and the solar forcing on Lean et al. (1995), updated to 1997. The net anthropogenic forcing at 1990 was 1.0 Wm-2 including a net cooling of 1.0 Wm-2 due to sulphate aerosols. The net natural forcing for 1990 relative to 1860 was 0.5 Wm-2 , and for 1992 was a net cooling of 2.0 Wm-2 due to Mt. Pinatubo. Other models forced with anthropogenic forcing give similar results to those shown in b (see Chapter 8, Section 8.6.1, Figure 8.15; Hasselmann et al., 1995; Mitchell et al., 1995b; Haywood et al., 1997; Boer et al., 2000a; Knutson et al., 2000). ------------------------------------------------------------------------ Solar & Volcanic anthro forcings only anthro & natural forcings