Download
1 / 55
550 likes | 682 Views
On the causes of correlations seen in Affymetrix GeneChip data. Dr Andrew Harrison University of Essex harry@essex.ac.uk. Microarray informatics at Essex University Departments of Mathematical Sciences and Biological Sciences. Faculty Degrees in ….. Dr Andrew Harrison Physics

E N D
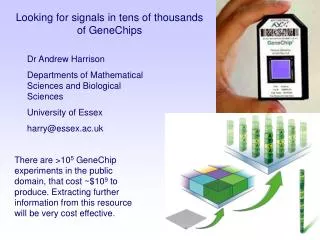
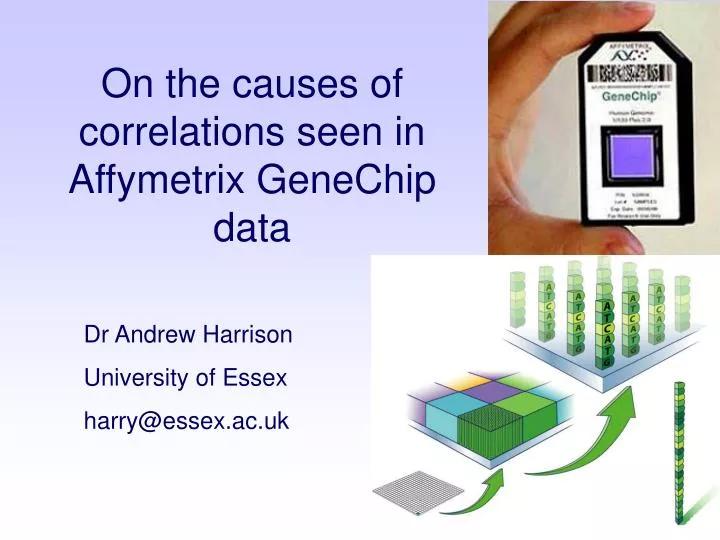
On the causes of correlations seen in Affymetrix GeneChip data Dr Andrew Harrison University of Essex harry@essex.ac.uk
Microarray informatics at Essex University Departments of Mathematical Sciences and Biological Sciences FacultyDegrees in ….. Dr Andrew Harrison Physics Professor Graham Upton Statistics Dr Berthold Lausen Statistics Postdocs Dr Olivia Sanchez Computer Science & Bioinformatics Dr Maria Stalteri Inorganic Chemistry & Bioinformatics PhD students Joanna Rowsell Mathematics Jose Arteaga-Salas Statistics Farhat Memon Computer Science Fajriyah Rohmatul Statistics
We are developing informatics tools to aid the analysis of Affymetrix GeneChips. There are many thousands of scientific publications that have resulted from GeneChip technology.
Many laboratories have an almost identical set-up for running GeneChips.
Probe cells of an Affymetrix Gene chip contain millions of 25mer oligonucleotide probes, which are grown through photolithography. Density of initiation sites for photolithographic probe synthesis is ~5×10¹³ molecules/cm2. The photolithographic steps have a yield of ~0.92-0.94. There will be 0.9225 (10%) to 0.9425 (20%) full length probes. This gives a full length probe density of 5-10 × 1012 cm-2. Thus there will ~ 3 nm between adjacent full length probes (c.f. diameter of DNA is ~2 nm). Full length probes (with linker) are ~20 nm.
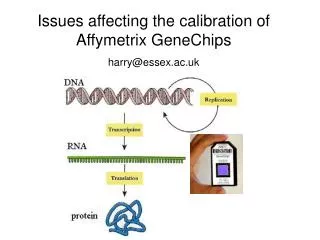
Detect fluorescence Remove partial hybrids by washing in a solution with a reduced salt content (phosphate backbones of nucleic acids have negative charge). Labelling with a fluorescent marker (on the Us). Hybridization Fragmentation of RNA to mean length of ~100 bases.
Affymetrix software derives the intensity for each probe from the 75% quantile of the pixel values in each box.
Affymetrix microarrays 5’ 3’ GTGGGAATTGGGTCAGAAGGACTGTGGCTAGG GGAATTGGGTCAGAAGGACTGTGGC GGAATTGGGTCACAAGGACTGTGGC perfect match probe cells mismatch probe cells Probe-pairs scattered on chip
Probe cell (aka feature) Probe pair Affymetrix probe set Perfect Match (PM) Mismatch (MM) The probes are not physically adjacent on the chip The biggest uncertainty in GeneChip analysis is how to merge all the probe information for one gene - Harrison, Johnston and Orengo, 2007, BMC Bioinformatics, 8: 195
dChip, RMA and GCRMA ‘model’ the systematic hybridisation patterns when calibrating an expression measure.
Once chips have gone through the DATCELExpression Measure process, changes in gene expression between conditions or over time can be observed. m=log2(Fold Change), a=log2(Average Intensity) The change in expression between two conditions for all the genes on an array can be viewed on a MA plot
Some genes are represented by multiple probe-sets. Probe-set A Probe-set B If they are measuring the same thing the signals should be up and down regulated together! Is that always true? No Stalteri and Harrison, 2007, BMC Bioinformatics, 8:13
Probes map to different exons. Because of alternative splicing, some of the exons may be upregulated whereas others may be downregulated.
Genes come in pieces. But exons do not. Multiple probes mapping to the same exon should measure the same thing.
CONCLUSIONS I Genes come in pieces. Each exon needs to be considered, and classified, separately. Check that your assumptions don’t contradict known biology.
The Essex approach The data from many tens of thousands of GeneChips are freely available in the public domain, in repositories such as GEO. We are mining this data. We are able to discover signals in GeneChips surveys which will be invisible to analysts dealing with single experiments. We are developing tools to enable analysts of single experiments to utilise the signals we have discovered. Our research is funded by the BBSRC (UK)
Ensembl 48 probes information exons, genes and transcript information using the BioMart query tool Microarray data megaBLAST Text files repository: sequence files, sequence mappings • Perl programs • SQL queries • Linux scripts sequence alignment of probes to genetic products Local database • mysql db • Linux OS Output
We are studying the correlations in expression across >6,000 GeneChips (HGU-133A), sampling RNA from many tissues and phenotypes.
The correlations in intensities (log2) between probes in probeset 208772_at on the HG-U133A array. The number in each square is the correlation ×10 Blue = low correlation Yellow = high correlation Average intensity in GEO Probe order along the gene The correlation calculated for PM probes 9 and 11 , the data in the earlier scatter plot, is reported as 8 (0.76 multiplied by 10 and rounded).
This probeset shows no coherent correlations amongst its probes.
Probes 1-11 all map to the same exon. This is a different probe-set mapping to the same exon – there seems to be one outlier.
The outliers correlate well with thousands of probes, taken from many different probesets. Correlation: Red 1; Yellow 0.75; Green 0.5; Blue 0
There is little sequence similarity between the probes, they are from probe-sets picking up different biology, yet they are correlated! TCCTGGACTGAGAAAGGGGGTTCCT GAGACACACTGTACGTGGGGACCAC GGTAGACTGGGGGTCATTTGCTTCC Virtually all of the probes in the group have runs of Guanines within their 25 bases.
Comparing probes with runs of Gs. Number of contiguous Gs Mean Correlation 3 0.14 4 0.42 5 0.49 6 0.62 7 0.75 We are only looking at a small fraction of the entire probe, yet it is dominating the effects across all experiments.
Hybridization kf Probe + Target Duplex kr Dissociation R is the Gas Constant, and T is temperature. G = - RT ln K All spontaneous physical and chemical changes take place in the direction of a decrease in free energy, G < 0
Phosphates on chains of nucleic acids have a negative charge. There is a coulomb block of hybridization on microarrays (Vainrub and Pettitt 2002). The environment caused by probe-probe interactions acts to modify the hybridization of RNA. Hagan and Chakraborty 2004, Journal of Chemical Physics The strength of binding depends upon probe density G = - RT ln K
A tetrad of Guanines can bind to each other through Hoogsteen Hydrogen bonds with the help of a central cation. G-quadruplexes are prevalent in telomeres (single stranded DNA at the end of chromosomes). G-quadruplexes are thermally stable. G-quadruplexes take a range of topologies.
Adjacent probes within a cell on a GeneChip have the same sequence – a run of Guanines will result in closely packed DNA with just the right properties to form quadruplexes. Upton et al. 2008 BMC Genomics, 9, 613
Parallel G-quadruplexes have a left-handed helical twist. We suggest 4 probes can efficiently form a “Maypole”. Outside the corset of the “G-spot”, the probes have little affinity for bases of the same sequence and the phosphate backbones will repel each other. Inside the G-spot the bases are on the inside and cannot bind target. GGGG
GGGG GGGG GGGG G = - RT ln K Probes that are not bound in G-quadruplexes will have a reduced probe density in the immediate environment of the runs of Guanines. This will result in very effective nucleation, and binding, with respect to hybridization to the rest of the probe. The binding will efficiently occur in the G-spot. Any RNA molecule with a run of Cs will hybridize. Thus, there will be enhanced correlations between all the probes that are able to form G-quadruplexes.
CONCLUSIONS II Probes containing a contiguous run of 4 or more guanines (a G-spot) are correlated with all the other probes which have similar runs of guanines. These probes are not measuring expression of the gene for which they chosen. Simple heuristic: Ignore the signals from probes containing G-spots.
Single Nucleotide Polymorphisms (SNPs ) • SNPs: a single base pair is different between one individual and the other. Polymorphism: if at least two variants have frequencies > 1% in a population.
snp_id probe_id probe_position_heatmap snp_position_probe allele sequence rs13505 219768_at-2-233 8 24 C/A CTGAATTTAGATCTCCAGACCCTGC O rs13505 219768_at-602-267 9 4 C/A CCTGCCTGGCCACAATTCAAATTAA O ENSE00001416163 HG_U133A(5,374 CEL files) SNP in only outlier probes
snp_id probe_id probe_position_heatmap snp_position_probe allele seq rs11038 221667_s_at-512-441 10 13 A/G GTTTATGATCTGACCTAGGTCCCCC N rs6413487 221667_s_at-570-641 9 7 C/G TAAGGACGCTGGGAGCCTGTCAGTT N ENSE0000129003HG_U133ASNPs in only no-outlier probes
Examination of SNP-Outlier Associations Cross-validation for HG_U133_Plus_2
Gs, CCTCC CCACC, GGTGG • Outlier SNP-probes in HG_U133_Plus_2 with “problematic” sub sequences (PS): • G’s (>=4), CCTCC, CCACC, GGTGG Outlier probes No-outlier probes
CONCLUSIONS III Probes overlapping SNPs sometimes appear different from other probes from within their probe-set. But there are other examples in which there is no difference. However, when there is a difference this may not be due to biology. It may be due to coincidental overlaps with other causes of outliers.
Kerkhoven et al. 2008, PLoS ONE 3(4): e1980 Probes containing GCCTCCC will hybridize to the primer spacer sequence that is attached to all aRNA prior to hybridization.
CONCLUSIONS IV Probes containing complementary sequences to primer spacers may not measure gene expression. Simple heuristic: Ignore the signals from probes containing CCTCC.
Log(magnitude) of averaged probe values Colour coded by size. Note the perimeter of bright-dark pairs. Cell (0,0) contains a probe which does not measure any biology
Corner correlations(correlations with values in cell (0,0)) Numbers are correlations times 10 (red greater than 0.8) Negative correlations appear as blanks Filled circles indicate probes not listed in CDF file. Large circles indicate correlations greater than 0.8
Correlations with cell (0,0) Being in the opposite corner has not reduced the correlations of the interior row and column
What are in the sheep pens? Entries are correlation with cell (0,0) Entries are log(mean(Intensity)) Sheep!
Many thousands of probes are correlated with each other simply because they are adjacent to bright probes. We believe that the focus of the scanner may be responsible – regions adjacent to bright spots will gain the same fraction of light. A comparison of many images at different levels of blurriness will appear to indicate that dark regions adjacent to bright regions are correlated in their intensities.
Sharply focussed arrays will have big values next to small values with big differences between them. However, out of focus arrays will have some of the big values falling into their small neighbours so that the differences will be smaller. We work with log intensities. We also contrast T for each array with a “master” array containing the mean intensities in GEO.