Download
1 / 55
550 likes | 748 Views
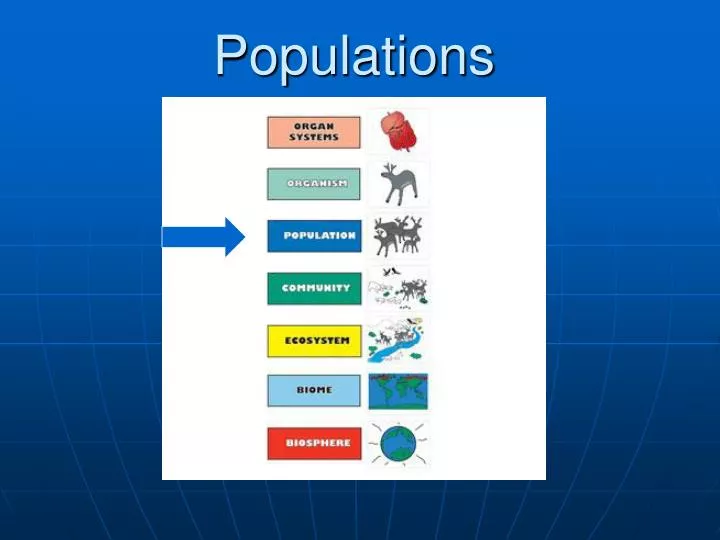
Populations. Definition of a Population. A population is a group of organisms of the same species that breed together and inhabit a specific geographic area. Changes in Population size. The number of organisms in a population changes with time

E N D
Definition of a Population A population is a group of organisms of the same species that breed together and inhabit a specific geographic area.
Changes in Population size The number of organisms in a population changes with time Individuals are always being added or subtracted from a population Pop’s increase by birth & immigration, decrease by death & emigration
Population Growth Equation (# births) – (# deaths) + (# immigrants) – (#emigrants) OR (# Births + # Immigrants) – (# Deaths + # emigrants) Birth = Natality Death = Mortality Extremely fast growth in a population is called a Population Explosion. Reasons for a population explosion include: • Plentiful food supply • Abundant space • Introduced (Alien) Species
Introduced/Alien Species Alien Species is the term for the introduction of a foreign species to a new environment. The Asian Carp is one example. Lack of predators & abundant food allows them to multiply easily The Great Lakes have suffered many problems because of the introduction of Zebra Mussels and other Alien Species
Population Extinction A Population Extinction occurs when a greater number of individuals leave a population compared to the number of individuals entering the population. (Due to Death or Emigration)
Some Reasons for Extinction Over-fishing Poaching Habitat Loss Climate Change
Graphing Population Growth • Called population growth curves • 2 Types: J-shaped and S-shaped
Exponential Growth J-Shaped - Population size increases slow at first, then rapidly increases Organisms have a high reproductive rate – reproduce at their full biotic potential Often populations that grow this fast will eventually crash (organisms die off quickly) – occasionally the population crash can lead to extinction Usually population will continually increase and decrease in what is called a population cycle
Population Cycles Sketch these:
Biotic Potential • is the maximum number of offspring that can be reproduced in a given time frame, if resources were unlimited. • For example, human females could theoretically produce 1 child every 9 months between the ages of approximately 12 and 45. • Organisms do not usually reproduce at their full biotic potential due to many different environmental factors (resources are limited).
Sigmoidal Growth (S-Shaped) Most populations grow in this fashion Population growth is fast at first but then slows down as the population becomes larger The point at which population growth levels out or becomes steady is when the number of births=deaths and immigrants=emigrants
S- Shaped Growth Curve Carrying Capacity
Carrying Capacity is the maximum number of organisms that an environment can support
Biotic Potential Video http://www.youtube.com/watch?v=BSVbdaubxxg&safe=active Populations Biotic Potential 2:58
Limiting Factors Limiting Factors are factors that prevent a population from growing larger. Also called Environmental Resistance. There are 2 main types: • density-dependent factors • density-independent factors.
Population Density Population size - the # of organisms occupying a certain amount of space.
Density Independent Factors Regardless of how many organisms are in a population, Density Independent Factors can limit population growth These factors can affect future population size
Density Dependant Factors • Predation • Competition • Disease (Plague, Flu, Rabies,etc..) • Parasitism • Resources (food, water, shelter, etc..)
Assignment Worksheets on pages 20 - 28
1. The number is increasing so rapidly in area A because there are favorable conditions for pollination…lots of male and female trees close together, good weather, lots of water and sunshine, lots of insect pollinators… 2. Fluctuations in section C are due to slight increases and decreases in population number due to DD factors that limit growth 3. B represents the Carrying Capacity of the area for Jack Pines 4. The average growth rate (net) in C is Zero (0)
5. Growth is slow at first, while numbers that can breed are low. Next there is a period of rapid population growth where many trees are reproducing at a very fast rate. Finally, when the population reaches the carrying capacity, the reproductive rate slows again such that the net growth = 0 6. The numbers of trees in the area would decrease . The graph would curve downwards in a “crash”. After a period of adjustment, the numbers will again begin to increase and the graph will turn to J shaped again. 7. Numbers of trees would decrease as the area is logged, but at a slower rate than if a forest fire wiped them out all at once
2. Large increase in deer could be due to them having lots of food, mild weather and low numbers of predators like wolves. 3. The deer population may have decreased because of high numbers of wolves, high numbers of deer competing for the same resources, deer hunting season, harsh weather, natural disaster (flood etc)
4. The wolf population was high because there were lots of deer for food. 5. The relationship between wolves and deer is related/correlated. When deer increase in number, so do wolves, and visa versa. 6. By extrapolation/estimated, there would be approx. 5000 deer and 33 wolves
7. Yes or No. Yes, if there are too many wolves, they could prey on domestic animals like cattle. No, they are following the natural course of their population cycle. • 8. • A. decrease • B. increase • C. decrease • D. decrease • E. increase
9. Hunting and trapping limits are calculated based on how many animals can be killed without putting the population in danger of crashing to low numbers or extinction. So when deer populations are high, then hunting limits can also be high.
Limiting Factors p. 25/26 1. DD – The larger the population, the larger the impact of the factor DI – the factor operates to its full extent no matter how big the population is 2.a. DD (competition) b. DD (predation) c. DI (weather)
D. DI (natural disaster) E. DD (stress, disease, competition, lack of food,water, shelter, jobs) F. DD (predation) G. DI (natural disaster) H. DD (overcrowding – lack of….) I. DD (overcrowding - disease) J. DI (severe weather) K. DD (no predators) L. DD (competition) M. DI (severe weather)
1. December = 2 2. January = 900 3. 400 000 4. 1 800 000 000 5. At first the population needs time to adjust. There are only a few males and females to mate in the beginning and many more later on.
6. Things flies compete with are dogs, humans, other insects, bacteria 7. Factors that changed when the window was opened include temperature, other insects came in, some flies flew away 8. DD factors: food, water, space, predators, disease, overcrowding, stress
9. DI factor: Temperature 10. Drought is DI. It causes a reduction in food supply regardless of how many individuals are in the population 11. Competition is DD. The more individuals, the more competition for food, water, space, etc.
Populations video p. 29/30 23 minutes
Eyes of Nye Video p. 29/30 1. world population reached 6 billion 2. 5 billion 3. 9 billion 4. longer life expectancy, more food, better food, better medicine 5. 150 6. population explosion/exponential growth/J-shaped growth
7. The World’s Fair was in 1965. World Pop was 3 billion. It took 34 years for the world pop to double (1999-1965) 8. In order to help reduce the growth rate, the UN decided that women should be entitled to be in control of the size of their family. That meant that women needed to receive higher education
9. Nearly ½ of the people on our planet are under the age of 25 10. A woman is fertile for approx. 30 years. Because there are so many young females on Earth right now, there lies a possibility of massive population growth 11. China passed the One Child/family law. Yes the law worked and population growth slowed down. Population size has decreased by over 200 million.
12. China, India, US 13. The 2.1 replacement rate means that most couples are having 2 kids while some arent having any. This is important because it has resulted in a net population growth is close to zero, which means births are almost equal to deaths. The US pop is still growing because of immigration.
14. Just 5% of the worlds population lives in the US yet US citizens consume 30% of the worlds resources 15. Three planet Earth’s 16. Bill suggests that reducing the growth rate to 1.7. In other words, deaths need to be higher than births so that overall population size will decrease. (Replacement rate is 2 – 2 kids for 2 parents)
1. Can’t bring foreign plants and animals into a country they didn’t live in before because these “alien” species could multiply out of control and destroy the native environment. 2. Bullfrogs 3. The number of frogs increased exponentially – population explosion
4. The introduced frogs ate all the crops 5. Lisa said that’s what happens when you introduce a foreign species into an ecosystem that can’t handle them 6. Koala’s only eat Eucalyptus trees which we don’t have here so probably they wouldn’t survive 7. Realistic concept. It actually happens in real life
Toxic Toads Worksheet p 35/36 1. Cane Toads were introduced to Australia from Hawaii in 1935 2. Although not specified in the article, it was the Bureau of Sugar Experiment Stations, an Australian government research institution 3. The toads were introduced in an effort to control the spread of beetles that were destroying sugar cane crops
4. The rate of invasion was 30 miles/year 5. Three reasons for the ever increasing numbers of toads include having lots of food, no predators, and having a high reproductive rate 6. When an Alien species is first introduced, it multiplies very slowly as it takes time to adapt to the new environment
7. An ecological nightmare may occur if the toads outcompete native species to the point of their extinction. That will lead to a domino effect of other species extinctions. The toads will be the dominant species and multiply out of control until their population crashes too.