Download
1 / 51
520 likes | 750 Views
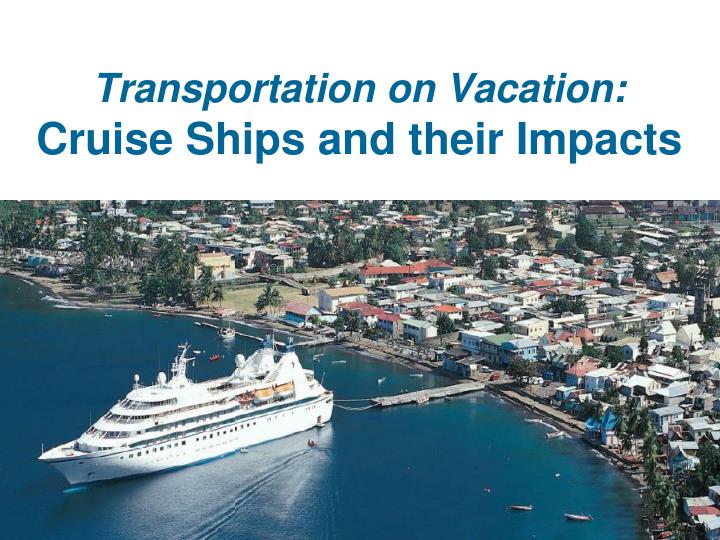
Transportation on Vacation: Cruise Ships and their Impacts. http://www.bluewaternetwork.org Click on image to download report in PDF format. BIG SHIPS. 3.6 Canadian football fields / 4.9 Thai football fields long. 360 m long. 6296 passengers.

E N D
http://www.bluewaternetwork.org Click on imageto download report in PDF format
BIG SHIPS 3.6 Canadian football fields /4.9 Thai football fields long 360 m long 6296 passengers World's biggest cruise ships:Royal Carribean’s “Oasis of the Seas“ (2009)“Allure of the Seas” (2010)
BIG SHIPS World's 2nd biggest cruise ship:Royal Carribean’s "Freedom of the Seas“338.91 m / 3,634 passengers
BIG SHIPS World's 3rd largest cruise ship:Cunard’s “Queen Mary 2” 345 m / 3056 passengers
Cruise ships keep getting bigger: Year Passengers Ship Cost ($US) 1996 1,800 $400 million 2006 3,600 $720 million 2010 6,296 $1.4 billion THE BIGGEST SHIPS • Royal Carribean’s “Oasis of the Seas“ • 6,296 passengers • 225,282 tonnes • 360 metres (1,181 ft) long • 47 m (154 ft) wide • Cruising speed: 22.6 knots (41.9 km / hr)
BIG FLEETS Total ships operating in U.S. • 1996: 131 • 2006: 200 Number of new ships • nine or more new cruise ships added globally every year since 2001, all at 100,000 GT or greater.
5 million 19 million 47% Number of passengers taking a cruise in 1996 Number of passengers taking cruises in 2011 Increase in cruise passengers 2001-2006 BIG GROWTH
BIG GROWTH Source: UNWTO (2010): Cruise Tourism – Current Situation and Trends
BIG GROWTH Source: UNWTO (2010): Cruise Tourism – Current Situation and Trends
BIG BUSINESS There are approximately 64 operational cruise linesregistered worldwide in 2012 A US $29.4 billion dollar industry in 2011
BIG BUSINESS Carnival and Royal Caribbean together control most cruise line brands and 80 percent of the market: Profits of > $US 3.0 billion in 2005
BILLION DOLLAR CRUISING 88% of the world’s supply of cruise ship bed-places is controlled by three large groups: • Carnival Corporation & Plc • Royal Caribbean Ltd. • Star Cruises • very close to an oligopoly • These three multi-brand groups encompass all market segments and operate very modern fleets (average age about 12 years).
BILLION DOLLAR CRUISING • 2005: $11 billion revenues $2.3 billion profit • 2004 $9.7 billion revenues $2.2 billion profit • One of the largest and most profitable tourism companies in the world. • Stayed profitable during and after 2009 economic meltdown
BILLION DOLLAR CRUISING • 2005 $4.9 billion revenues $716 million profit • 2004 $4.5 billion revenues $475 million profit • Stayed profitable during and after 2009 economic meltdown
Additional costs of ‘all-inclusive’ cruises Hidden costs and camouflaged price increases: • port fees • taxes (e.g., 50% of taxes returned to cruise company in Belize) • fuel surcharges (not always justified) Optional onboard expenses / upselling: • gratuities • overpriced shore excursions (100% markups typical) • vertical integration (‘company store’ syndrome) • controlled onshore shopping destinations • casinos • phone and internet services • alcoholic beverages • cooking lessons, spa services, fitness classes • premium restaurants
Royal Caribbean’s lobbying costs 1997-2004 Carnival Corporation’s lobbying costs, 1997-2004 International Council of Cruise Lines lobbying costs, 1997-2004 $900 million $2.5 million $1.6 million BIG INFLUENCE
19 to 26 litres 1.58 billion litres 4.8 km (3 miles) 0 km Sewage dumped per passenger per day Sewage dumped per year Distance from shore where raw sewage is dumped Distance from shore where treated sewage and raw graywater are dumped BIG POLLUTION
See online lists: Pollution and Environmental Violations and Fines, 1992 – 2012 (Only those reported in the media or public documents) http://www.cruisejunkie.com/envirofines.html Large Environmental Fines ($100,000 or more) http://www.cruisejunkie.com/largefines.html BIG POLLUTION
US $25 million US $50 million Fines paid by cruise lines in U. S. for illegally dumping oily water and air pollution violations, 2000 - 2005 Fines paid for illegally dumping oily water and destroying coral reefs, 1995-1999 BIG FINES
BIG FINES • 1998 and 1999. Royal Caribbean Cruises pleaded guilty to 30 charges and was fined $27 million for a fleetwide conspiracy to dump oily bilge wastewater into U.S. waters. Article:http:/www.usatoday.com/travel/news/2002/2002-11-08-cruise-dumping-side1.htm How they did it: • http://www.usatoday.com/travel/_graphics/gcruisedumping/flash.htm
0 37 Monitoring of cruise ship sewage dumping by U.S. Coast Guard in federal waters Number of years cruise ships have been exempted from discharge laws in the U.S. Clean Water Act of 1973 BIG LOOPHOLES
0 10 New national laws passed to control cruise ship dumping since 1973 Years without response from the U.S. EPA since Bluewater Network and 58 groups filed petition to control cruise ship pollution BIG LOOPHOLES
200 0 Number of cruise ships dumping sewage in U.S. waters Number of cruise lines supporting no discharge zones in U. S. waters LACK OF SPENDING ONAIR AND WATER QUALITY
79 out of 80 20 Number of sewage samples taken in Alaska that failed federal standards in 2005 Number of ships treating sewage to higher Alaska standards LACK OF SPENDING ONAIR AND WATER QUALITY
LACK OF SPENDING ONAIR AND WATER QUALITY A cruise ship in Milford Sound, New Zealand, with stack exhaust gases constrained by an inversion layer
LACK OF SPENDING ONAIR AND WATER QUALITY Passenger excursion ship (1912 steamer TSS Earnslaw) on Lake Wakatipu, near Queenstown, New Zealand
0 43 Number of U. S. cruise ships with advanced air pollution controls Number of Swedish cruise ships, large ferries and ships with advanced air pollution controls LACK OF SPENDING ONAIR AND WATER QUALITY
2 6 3 Number of cruise lines equipping ships to plug into shorepower Number of cruise ships equipped to plug into shorepower Number of U.S. ports equipped with shoreside power hook-ups for cruise ships LACK OF SPENDING ONAIR AND WATER QUALITY
16 4 2 1 Number of states where cruise ships call Number of states with cruise ship pollution laws Number of states with voluntary agreements Number of states that ban cruise ship dumping LACK OF SPENDING ONAIR AND WATER QUALITY
U.S. FEDERAL LEGISLATION PROPOSED (AGAIN) 111th Congress (2009) History: 111th Congress: H.R. 3888Dead 110th Congress: S. 2881Dead 110th Congress: H.R. 6434Dead 109th Congress: S. 793Dead 109th Congress: H.R. 1636Dead 108th Congress: S. 2271Dead 108th Congress: H.R. 4101Dead
ENVIRONMENTAL IMPACTS OF CRUISE SHIPS Waste discharges to water Liquid wastes: • Sewage • Grey water • Oil • Hazardous liquid wastes
ENVIRONMENTAL IMPACTS OF CRUISE SHIPS Waste discharges to water Solid wastes: • inorganic • organic (primarily food wastes)
ENVIRONMENTAL IMPACTS OF CRUISE SHIPS Waste discharges to air ‘Master’ and ‘slave’ engines • Master engines: used for propulsion • Slave engines: used for electricity generation Marine engines generally burn cheap residual fuel oil of low quality (‘bunker oil’, not standard diesel fuel).
Air Quality A cruise ship’s diesel engines can emit as much exhaust as 10,000 cars, even when idling in port.
Air Quality New fuel formulations containing glycerol and surfactants have improved emissions, but cost more – Science Daily, Aug. 2012
ENVIRONMENTAL IMPACTS OF CRUISE SHIPS Waste discharges to air: Solid waste incinerator emissions: • gaseous emissions • particulate emissions • greenhouse gases Annex VI of MARPOL (International Convention for the Prevention of Pollution From Ships) is concerned with the prevention of air pollution from ships.
ENVIRONMENTAL IMPACTS OF CRUISE SHIPS Some progress: EPA's Clean Diesel Locomotive and Marine program • Audio Soundbite:Stephen L. Johnson,EPA Administrator • Listen to or download the audio file (MP3, 0:21 secs, 514 KB)
ENVIRONMENTAL IMPACTS OF CRUISE SHIPS Biosecurity risks: • Hull fouling by organisms • Organisms in ballast water • Undeclared food items, plants, and animals taken on or off ships • Bio-stowaways (rats, vermin, etc.)
ENVIRONMENTAL IMPACTS OF CRUISE SHIPS Risks from maritime accidents • Leaks • Fuel spills • Physical wreckage • Hazardous substances • Salvage operation impacts
ENVIRONMENTAL IMPACTS OF CRUISE SHIPS Effects on wildlife • Behavioural disturbances • Avoidance behaviour • Adaptation to humans • Scavenging behaviour • Direct safety threats • Collisions
ENVIRONMENTAL IMPACTS OF CRUISE SHIPS Increased Turbidity • Sediment stirring and disturbance from propulsion and wakes of ship • Increased wave action • Direct discharge of solid matter • Coastal / shoreline erosion
A plume of silt stirred up by a cruise ship in Key West stays in suspension and is carried by the tides to smother the only living coral reef in North America.
ENVIRONMENTAL IMPACTS OF CRUISE SHIPS Anchor damage • Mechanical damage to sea floor • Dragging damage
ENVIRONMENTAL IMPACTS OF CRUISE SHIPS Antifouling chemicals • Heavy metals • Toxic compounds • Hull paint flaking
ENVIRONMENTAL IMPACTS OF CRUISE SHIPS Impacts on shore communities • Water consumption and pollution • Sewage • Energy and fuel use • Souvenir and artifact production and sale • Food consumption and distribution