Download
1 / 21
210 likes | 329 Views
Assessment of PWT Conditions for the STARDUST Post-Flight Analysis. Ricarda Wernitz, Markus Fertig, Georg Herdrich, Stefan Löhle, Michael Winter, Hans-Peter Röser Speaker: Sebastian Lein. Contents. STARDUST reentry observation campaign STARDUST observation campaign SLIT experimental set-up

E N D
Assessment of PWT Conditions for the STARDUST Post-Flight Analysis Ricarda Wernitz, Markus Fertig, Georg Herdrich, Stefan Löhle, Michael Winter, Hans-Peter Röser Speaker: Sebastian Lein
Contents • STARDUST reentry observation campaign • STARDUST observation campaign • SLIT experimental set-up • Data reduction and evaluation • Results • IRS Plasma Wind Tunnels • Characterization of plasma conditions for experimental rebuilding of STARDUST reentry in PWK 1
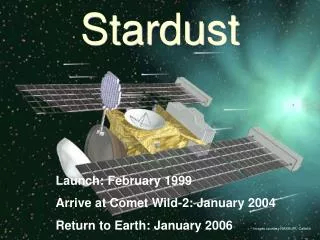
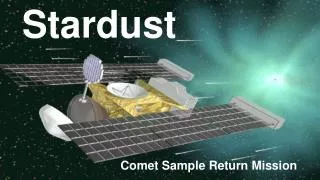
STARDUST Sample Return • Sample return from comet Wild 2 • Fastest re-entry ever of an artificial object • 15.1.06, 1:56:42 a.m. • Ablative heat shield • PICA (phenol impregnated carbon) • No instrumentation on board
STARDUST Sample Return Mission, Comet Wild 2:Fastest Re-entry Ever (12.8 km/s)
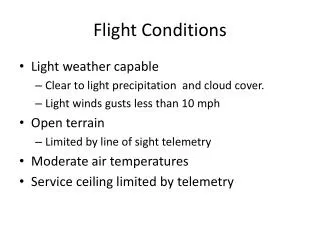
SLIT NASA Observation Campaign • DC8 at 14 km flight altitude • International Participation (USA, Japan, Germany) • IRS SLIT experiment: Emission spectrometry in near UV • Advantages: Fixed wavelength range, comparatively high spectral resolution • But: Difficult tracking due to small angle of vision
SLIT Experimental Setup - Spectrometer Full vertical binning Spectrometer Fiber orientation at spectrometer entry FO bundle 50x100µm Fiber orientation telescope angle of vision 0,45° • Exposure time: 0.2 s • 250 to 2500 photons/pixel at telescope entrance telescope EMCCD camera
SLIT Experimental Setup - Tracking Tracking camera • Intensifier: • angle of vision 20° • grid glued to intensifier screen video camera intensifier lens system (telescope) Angle of vision Spectrometer 0.45°
Evaluation of SLIT Data: Data Reduction • Background radiation, cosmic rays and atmospheric absorption (ModTran) • Wavelength and intensity calibration • Allocation of time and space • Distance and orientation of the DC8 (GPS) • Separation of Planck (heat shield) and plasma radiation • Heat shield temperatures • Analysis of plasma radiation
Evaluation of SLIT Data: Data Reduction • Background radiation and cosmic rays • Wavelength and intensity calibration • Allocation of time and space • Distance and orientation of the DC8/SRC • Separation of Planck (heat shield) and plasma radiation • Heat shield temperatures • Analysis of plasma radiation
Separation of Planck and Plasma Radiation • Spectra fit at two different temperatures: • T=50K • lower temperatures at smaller wavelengths • Possible inaccuracies: • scattered light • assumption of linear temperature distribution along capsule Decreasing sensitivity towards UV → higher simulation temperature preferable
Heat Shield Temperatures • Maximum temperature at peak heating (64 km) 2850 K • Upper limit for heat shield temperatures • Thermal radiation of ablation particles not taken into account • Linear temperature distribution along capsule assumed
Molecular Temperatures • Spectra simulated using PARADE • Varying rotational and vibration temperatures • Obtaining molecular temperatures via best fitting simulations to experimental data Fitting measured and simulated spectra temperatures at best agreement • Satisfactory agreement. Not every peak simulated.
Molecular Temperatures 62 km ~ Peak heating Fitting measured and simulated spectra temperatures at best agreement • Satisfactory agreement, not every peak simulated.
Molecular Temperatures Fitting measured and simulated spectra temperatures at best agreement • Agreement between simulation and experiment increases with decreasing altitude
Evaluation of SLIT Data Molecular temperatures: • Fit to simulated spectra (PARADE) • Data base for CN and N2+ generated for Trot < 10000 K and Tvib < 15000 K • Tvib,CN decreases from > 15000 K at 75 km to 8000 K at 50 km • Tvib,N2+ increases with decreasing altitude • Tvib,N2+ higher than 15000 K (max. simulated temperature) in a wide range • Both rotational temperatures do not exceed 10000 K
PWT: Experimental Entry Simulation Inductively heated plasma generators (IPG) Arc-driven thermal plasma generator (TPG) • Specific enthalpy: 1-80 MJ/kg • Pressure: 1-15 hPa (Luft) / 50 hPa (O2) • Gases: arbitrary, e.g. N2, O2, Ar, H2, CO2 or any combination thereof • Specific enthalpy: 1-30 MJ/kg • Pressure: 1-1000 hPa • Gases: N2+O2, Ar, Ar+O2, N2, H2, N2+CH4, Ar+CO2 H2+O2, He IPG3 (PWK3) Magnetoplasmadynamic generators (MPG) RD5/7 (PWK1/2) • Specific enthalpy: 2-150 MJ/kg • Pressure: 1-100 hPa • Gases: N2+O2, Ar, Ar+O2, N2, • H2, N2+CH4, Ar+CO2, He RB3 (PWK4)
Experimental Rebuilding: Axial Profiles of Heat Flux and Total Pressure • Max. heat flux at x=177 mm from nozzle: 12.1 MW/m2 • 147 V, 1483 A, pamb=27 hPa • 13.85 g/s N2, 4.21 g/s O2, 0.49 g/s Ar • Total pressure 38 hPa Maximum heat flux of STARDUST reproduced
Experimental Rebuilding: Characterization of Plasma Conditions • Increasing current at x=197 mm from plasma source: • Increasing current from • Test1: 1433 A to 1730 A • Test2: 1421 A to 1967 A • Max. heat flux at 197 mm from nozzle: Test2: • 14 MW/m2 • 151 V, 1965 A • 13.67 g/s N2, 4.2 g/s O2, 0.49 g/s Ar • 38.7 hPa
Summary • Preliminary post-flight analysis of STARDUST reentry • Data acquisition and reduction • Numerical simulation of emission spectra → identification of plasma species → identification of Planck, rotational and vibration temperatures • Characterization of plasma conditions • Heat fluxes of up to 14 MW/m2 reproduced • Maximum heat flux of STARDUST reproduced