Download
1 / 17
180 likes | 357 Views
Risk Assessment using Flight Data Analysis. Dr. Thom Mayer Austin Digital Inc. International Aviation Safety Conference June 4, 2008. Measuring Accident Risk using Flight Data based on work done 2005 to present (No actual Airline results are shown. Any results shown are not real data.)

E N D
Risk Assessment using Flight Data Analysis Dr. Thom Mayer Austin Digital Inc. International Aviation Safety Conference June 4, 2008
Measuring Accident Risk using Flight Data based on work done 2005 to present (No actual Airline results are shown. Any results shown are not real data.) Future Directions for Analytical Risk Assessment Suggestion of where to go next with the technique Risk Assessment using Flight Data Analysis
FDM Provides the Ability to Measure every Flight the mean and standard deviation of the distribution tell about “standard flight operations” but to study safety risk we need to look at the tails of the distribution
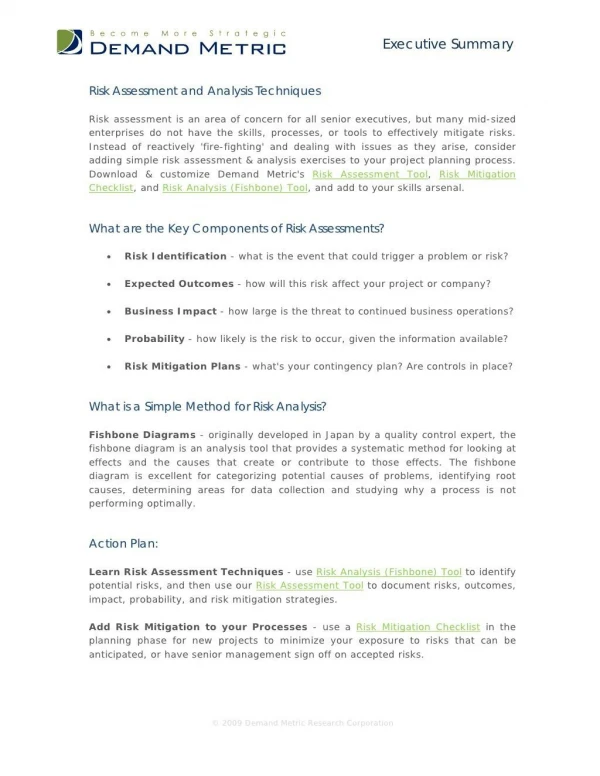
For risk measurement purposes we need measures for closeness to each accident category • Controlled Flight into Terrain (CFIT) ………...………………………………....... • Landing Overrun ……………………………………………………………............ • Fuel Exhaustion ……………………………………………………………….......... • Stall ………….…………………………………………………………………......... • Hard Landing ………………………………………………………………….......... • Takeoff Runway Overrun ……………………………………………………......... • Landing Offside ……………………………………………………………….......... • Landing Short ……….……………………………………………………............... • Runway Incursion ……….………………………………………………............... • Fuel Tank Explosion ……….……………………………………………............... For some accident categories the measure is relatively straight-forward, but for other accident categories a good measure is more involved. Risk Assessment – 2006 Company Confidential - Do Not Distribute
So it is believable that there is a relationship between accident rates (i.e. risk) and the frequency and severity of “near misses” a “near miss” accident threshold distribution of how the event could have played out measure of closeness to accident category Why does one believe that a flight that only came close to an accident represents risk?Because variations in other variables could have caused a different outcome.( i.e. variations in winds, weight & balance, training, reaction times, …)
Our approach takes advantage of a large population of flight data (i.e. 107) and the multi-year accident rate statistics Theoretical distribution that one could measure if we had infinite data tail of distribution measured from large sample of flights (actually it is sparse) actual accident “rate” measure of closeness to accident category accident threshold we define a mathematical measure of the tail of the distribution and “calibrated” it using a large pool of flights and the accident rate statistics for that population.
< 300 % Remaining #% B737 no data no data B747 8 0.010 B757 14 0.022 A320 0 0 A340 4 0.007 Airline 26 0.009 EMS Group 68 0.008 This enables one to compare risk between sub-populations • The “weight” of the tail of the entire population represents the accident rate statistics for that population. • The “weight” of the tail of a sub-population, compared to the “weight” of the tail for the entire population, give relative risk.
This Analysis is Performed for each Accident Category and each sub-Population Drill Drown > 25 % Decel Needed #% B737 680 0.6 B747 229 0.3 B757 342 1.3 A320 297 0.6 A340 218 0.7 Airline 1766 0.6 EMS Group 9125 0.5 > 35 % Decel Needed #% B737 2 0.005 B747 1 0.002 B757 4 0.010 A320 6 0.012 A340 2 0.005 Airline 15 0.008 EMS Group 39 0.005
The calculated risk is reported per sub-population(in this example the accident category is CFIT and the sub-populations are fleet type)
When the sub-populations are time intervals, the technique provides risk trending This data has been corrected to remove variations resulting from the addition or removal of fleets to the FOQA program from one quarter to the next.
One can drill down into specific runways and fleet combinations(note that as you drill down, the error bars become larger)
Using this technique we generate an Annual Risk Assessment Report to Participating Airlines Risk Assessment 2006 Risk Assessment – 2006 Company Confidential - Do Not Distribute
What Types of Accident Risk are Assessed for this Report? Accident categories, representing 63% of American and European commercial jet passenger fleet fatalities were analyzed for this report. Risk Assessment – 2006 Company Confidential - Do Not Distribute
This Report is the Second Step of the Annual Risk Assessment Cycle Use this report to set goals (perhaps the reduction of a specific accident risk for each fleet) Risk Assessment – 2006 Company Confidential - Do Not Distribute
For each accident category, the report to the participating Airline includes a trending of risk for the group and the airline compared to the group, and a drill down of risk by fleet type and airport/runway. Airline Risk Overview Risk Assessment – 2006 Company Confidential - Do Not Distribute
What FDM capabilities do you need to support this type of Analysis? • Ability to generate sophisticated measures e.g. CFIT or risk of running off end of runway • Ability to support very low false positive rates if accident rate is 10-8 then “close call” rate might is 10-5, so false positives rate can’t be 10-3 • Ability to handle large numbers of flights We are getting close to 107 flights in the EMS group
What implications does this have for Data Aggregation from multiple Airlines? • Identical processing for all data Either the processing systems at the Airlines need to be identical, or aggregation needs to be at the flight data level • No “Cherry Picking” of data set Participants need to provide complete data set. Filtering of “Incident” or “Sensitive” flights would invalidate the data set. • Large Data Sets Required to get any resolution on drill-down