Download
1 / 24
240 likes | 392 Views
Welcome. Available at www.tisc.edu.au Marks Adjustment Process for University Admission 2011 Scaling Information Sheet Summary Scaling Statistics Combined Marks Corresponding to Specific Scaled Scores Histograms and Scaled Score Statistics for WACE Courses

E N D
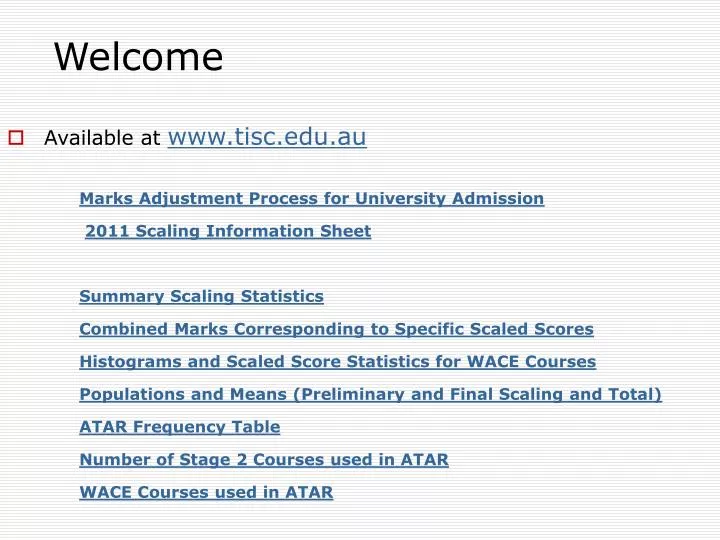
Welcome • Available at www.tisc.edu.au Marks Adjustment Process for University Admission 2011 Scaling Information Sheet Summary Scaling Statistics Combined Marks Corresponding to Specific Scaled Scores Histograms and Scaled Score Statistics for WACE Courses Populations and Means (Preliminary and Final Scaling and Total) ATAR Frequency Table Number of Stage 2 Courses used in ATAR WACE Courses used in ATAR
OVERVIEW OF 2010 • 104 examinations were sat (including 11 interstate languages) • Mathematics with 4 unit pairs scaled for first time • Scaling population had increased by approximately 11% • Scaling parameters Mean of all scaled scores is 60 Standard Deviation reduced from 14 to 13 • 2010 courses scaled scores means similar to 2009 • 12,264 students achieved an ATAR (11,012 in 2009) • 82.5 % of students who sat English achieved university competence in English (2481 stage 2 and 7568 stage 3) • Major reason for Scaling -- university ranking
Courses with stage 2 or 3 Only Combined Marks Course Scaled Scores 2010 COMBINED MARKS TO SCALED SCORESGeneral flow diagram (excludes maths) Combined Marks (Stage 2 scale) Adjusted Combined Marks Stage 2 (course scale) Course Combined Marks (Pooled) Preliminary Average Marks Scaling Combined Marks (Stage 3 scale) Adjusted Combined Marks Stage 3 (course scale) Adjusted Combined Marks Stage 3 + 15 Average Marks Scaling
Preliminary Scaling (stage 2 and stage 3) S2 mean 53.0 S3 mean 60.4 Final Combined Marks including Increment before Scaling the Course Course mean 68.8 S2 mean 53.0 S3 mean 75.4
Final Scaled Scores (Scaling Population) Course mean 58.2 S2 mean 45.4 S3 mean 63.4 Final Scaled Scores (Total Population) Course mean 54.7 S2 mean 41.2 S3 mean 62.9
2011 • 100+ exams • Stage 3 numbers > stage 2 in more courses? (In 2010, 25% of courses had more students doing stage 2) • Review of Increment
Comment on Education Schools and teachers to provide every opportunity for students to achieve their potential. (How many courses does your school offer at stage 2 only in Year 12?) Encourage and challenge students to undertake courses at the highest stage they are capable of doing. It follows that students will be best prepared for post secondary destinations of work or further studies. (Also achieve the highest ATAR they are capable of.)
Preliminary Scaling Adjusted Combined Mark +Increment Input to final scaling
Adjusted Combined Mark + Increment Input to Final Scaling Final Scaled Scores
26.5% 26.5% 15.1% 15.1% 0.7% 6% 6% 0.2% 2% 2% 0 0 10 10 20 20 30 30 40 40 50 50 60 70 80 90 100 Standardised Mark