Download
1 / 39
390 likes | 491 Views
Improving the Low-Redshift Foundations: Results from the Lick Observatory Supernova Search (LOSS). Alex Filippenko Department of Astronomy University of California, Berkeley. May 7, 2008. (Main collaborators: W. Li, J. Leaman, M. Ganeshalingam). Previous ESSENCE Hubble Diagram.

E N D
Improving the Low-Redshift Foundations: Results from the Lick Observatory Supernova Search (LOSS) Alex Filippenko Department of Astronomy University of California, Berkeley May 7, 2008 (Main collaborators: W. Li, J. Leaman, M. Ganeshalingam)
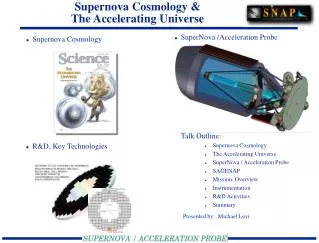
Previous ESSENCE Hubble Diagram 60 SNe Ia, 2002-2005 Wood-Vasey et al. (2007)
Preliminary Current ESSENCE Hubble Diagram 156 SNe Ia, 2002-2007 Wood-Vasey et al. (2008, in prep.)
KAIT 30 inch (0.76 m) mirror Funded by NSF, the Sylvia & Jim Katzman Foundation, the TABASGO Foundation, AutoScope Corp., Sun Microsystems, Hewlett-Packard Co., the University of California (Berkeley and Santa Cruz), and NASA. Lick Observatory; Katzman Automatic Imaging Telescope (Laurie Hatch)
Template New image NGC 523 Difference (after much processing) Undergraduate students examine the SN candidates that were found automatically. SN 2001en Cosmic ray
LOSS Cadence: 2-12 days 2001 - 2007, 1.5 million obs 200 gal: every 2 days 5,000 gal: every 5 days 10,000 gal: every 10 days No of obs Observation interval (days)
LOSS results: follow-up efforts • Prompt alerts to ~80 astronomers/SN observers • CfA Supernova program (Kirshner et al.) • Carnegie SN Program (Freedman, Phillips, et al.) • Follow up with our own telescope network KAIT Lick 1-m Lick 3-m Keck I/II 10-m 10-20% of time Photometry; calibration 6-9 nights/mon Calibration; photometry 3 nights/mon spectroscopy Occasional spectroscopy
Age: -6 days Maximum +26 days +47 days +102 days SN 1998dh(Type Ia)
Template subtraction; SN photometry (Automatic pipeline)
Preliminary results on SNe Ia (Ganeshalingam et al. 2008, in prep.)
2.0 SNe Ia 1.5 AV (mag) 1.0 0.5 0.0 Hubble type, E Sd/Irr 2.0 1.0 0.0 -1.0
SNe Ia (before correction)
SNe Ia (MLCS2k2)
SN 1998de before/after SN Ia 1998dh before/after
(Leonard et al. 2005, ApJ, 632, 450) (Leonard et al. 2005, ApJ, 632, 450)
SN 2005hk (Chornock et al. 2006) SYNOW model with 11 ions (Fe II, Fe III, Si II, S II, Ca II, Mg II, O I, Ni II, Co II, Ti II, C III) Vphot=5000 km/sec Chornock et al. 2006
CSP Observations of SN 2005hk (Phillips) • No secondary maximum in IR. • Strength of the secondary maximum correlated with the amount of mixing of 56Ni in the ejecta (Kasen 2006). • The absence of secondary maximum suggests complete mixing of 56Ni. H J
Supernova Rates Benchmark for z = 0 SN rate: Cappellaro et al. 1999 (C99 hereafter) *5 surveys (1 visual, 4 photographic plates) *137 SNe in about 104 galaxies *B-band luminosity normalization * SN rate as a function of SN type (Ia, Ib/c, II) and host morphology (E/S0, Sa/b, Sbc/d, Irr) • Mannucci et al. 2005 (M05 hereafter) • Same database as C99 • K-band luminosity normalization • SNr versus galaxy color (B-K)
Jesse Leaman Jesse
844 SNe observed (600 LOSS discoveries & 240 independent confirmations) SNe used* in the SN rate calculation for a given normalization technique and SN type: LOSS SN rates (1998-2006): Leaman, Li, & AVF (2008, in prep.) Filter| Ia | Ib/c | II | ? | Total B 247 97 284 14 642 K 235 93 274 13 615 B&K 227 87 265 12 591 *Only SNe for which we have all host-galaxy information were included
Units • 1 SNu = 1 SN / (100 yr) / (1010 LSun) (SNuB, SNuK for B and K bands) • 1 SNuM = 1 SN / (100 yr) / (1010 MSun)
SN Ia rate proportional to (1) SFR [prompt] and (2) galaxy mass [extended] (confirms Mannucci et al. 2004, 2005, Scannapieco & Bildsten 2005, Neill et al. 2006, Sullivan et al. 2006)
Volume SN Ia rate versus redshift (Dahlen, Strolger, & Riess 2008 compilation and new high-z results; dashed line = best 1-component model with delay time 3.4 Gyr.) LOSS rate =
Katzman Automatic Imaging Telescope (KAIT) (Laurie Hatch)