Download
1 / 38
380 likes | 505 Views
Evaluation of satellite data assimilation impacts on mesoscale environment fields within the hourly cycled Rapid Refresh. Haidao Lin Steve Weygandt Ming Hu Stan Benjamin Curtis Alexander. Assimilation and Modeling Branch Global Systems Division NOAA Earth System Research Lab

E N D
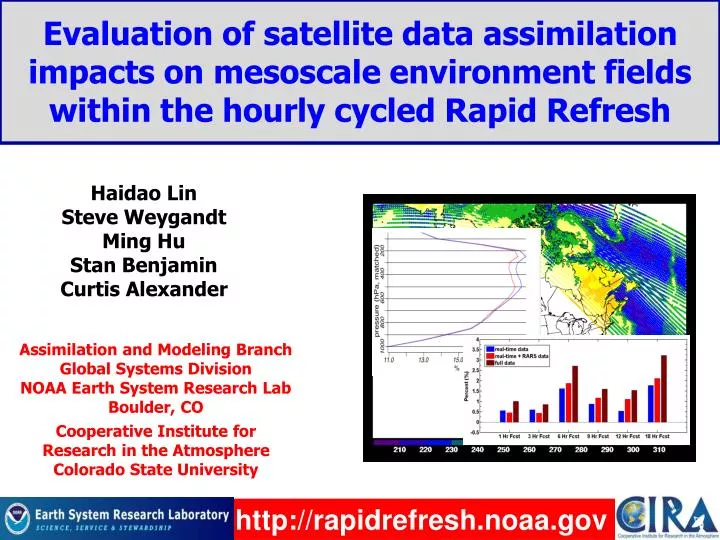
Evaluation of satellite data assimilation impacts on mesoscale environment fields within the hourly cycled Rapid Refresh Haidao Lin Steve Weygandt Ming Hu Stan Benjamin Curtis Alexander Assimilation and Modeling Branch Global Systems Division NOAA Earth System Research Lab Boulder, CO Cooperative Institute for Research in the Atmosphere Colorado State University http://rapidrefresh.noaa.gov
Presentation Outline • Background on Rapid Refresh (RAP) system • Background on regional radiance assimilation • satellite data types (geo / LEO, IR / microwave) • bias correction, channel selection, latency • Satellite radiance experiments • AIRS and GOES impact in RAP (retrospective) • - upper air and precipitation verification • Sensitivity to data latency (retrospective) • - upper air and precipitation verification • Real-time radiance impact in RAP • - upper air verification and Impact on HRRR (retro) • 4. Summary and future work
Background on Rapid Refresh NOAA/NCEP’s hourly updated model RAP version 1 -- NCEP since Spring 2012 • Advancedcommunity codes (ARW model, GSI analysis) • Key features for short-range “situational awareness”application(cloud analysis, radar DFI assimilation) • RAP guidance for aviation, severe • weather, energy applications Rapid Refresh 13-km RAP version 2 -- implemented NCEP 25 Feb. 2014 • DA enhancements (Hybrid – EnKF using global ensemble) • Model enhancements • (MYNN PBL, 9-layer LSM) HRRR 3-km RAP version 3 -- free for GSD summer evaluation
Observations Used Rapid RefreshHourly Update Cycle Partial cycle atmospheric fields – introduce GFS information 2x/day Fully cycle all land-sfc fields 1-hr fcst 1-hr fcst 1-hr fcst Back- ground Fields Analysis Fields Hybrid DA Obs Obs Hybrid DA Time (UTC) 11 12 13
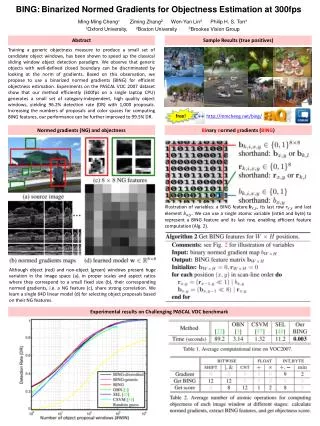
Radiance Data • AMSUA(used in operational RAP) • Temperature and moisture information • MHS(used in operational RAP) • Temperature and moisture information • HIRS4(used in operational RAP) • Temperature information • Moisture information (channels 10-12) • --------------------------------------------------------------- • AIRS (not in operational RAP, testing data) • High vertical resolution (hyperspectral) • Temperature and moisture information • GOES(not in operational RAP, in RAP V3) • Temperature and moisture information • Good hourly real-time coverage Challenge to show impact from radiance assimilation within the “full mix of observations” Measure improvement in upper-air verification and sensible weather
Radiance Assimilation for RAP • Challenges for regional, rapid updating radiance assimilation • Bias correction • -- Sophisticated cycled predictive bias correction in GSI • -- Spin-up period, complicated by non-uniform data coverage • Channel Selection • Many channels sense at levels near RAP model top (10 mb) • Use of these high peaking channel can degrade forecast • Jacobian / adjoint analysis to select channels for exclusion • Data availability issues for real-time use • Rapid updating regional models: short data cut-off, small domain • Above combined with large data latency little data availability • Complicates bias correction, partial cycle assimilation options
Variational Satellite Bias Correction in GSI Angle bias Observation Operator (CRTM) Air mass bias are the coefficients of predictors (updated at every cycle) mean constant (global offset) scan angle cloud liquid water (for microwave) square of T lapse rate T lapse rate Bias parameter background error covariance matrix (Derber et al., 1991, Derber and Wu, 1998) = predictors
AIRS Bias Correction Assessment Channel 1382 (water vapor channel ~866 hPa channel 252 (CO2 channel ~672h Pa Before BC After BC 9 day retro run averaged
Satellite Channel Selection for RAP Standard profile (0.01 hPa top) RAP profile (10 hPa top) Temperature Artificial sensitivity due to low model top in RAP dBT/dT (K/K) Moisture Artificial sensitivity due to low model top in RAP (dBT/dq) * q (K)
Radiance Channels Selected for RAP • AMSU-A(remove high-peaking channels) • metop-a: channels 1-6, 8-10, 15 • noaa_n15: channels 1-10, 15 • noaa_n18: channels 1-8, 10,15 • noaa_n19: channels 1-7, 9-10,15 • HIRS4 (remove high-peaking and ozone channels) • metop-a: channels: 4-8, 10-15 • MHS • noaa_n18, metop-a: channels 1-5; • --------------------------------------------------------------------------------------- • AIRS(remove high-peaking channels) • Aqua: 68 channels selected from 120 GDAS channel set • GOES (remove high-peaking channels and ozone channel) • GOES-15 (sndrD1, sndrD2, sndrD3, sndrD4): channels 3-8,10-15
Real-Time Data Availability -- RARS RARS feed (not used in real-time yet) Real-Time RAP 18Z May 29, 2013 RARS = Regional ATOVS Retransmission Services Assuming +/- 1.5 h time window IDEAL -- No latency/cutoff AMSU-A channel 3 from NOAA_18
Retrospective Experiments Set I: new sensors • Extensive retro run for bias coefficients spin up • Control run (CNTL) – Conventional data only • 1-h cycling run, 8-day retro run (May 28 – June 4 2012) • Hybrid EnKF RAP system • AIRS radiance experiment • CNTL + AIRS radiance data (no latency) • Using 68 selected channels for RAP • GOES radiance experiment • CNTL + real time GOES 15 radiance data (sndrD1,sndrD2,sndrD3, sndrD4)
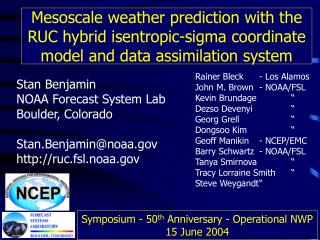
Impact from AIRS and GOES data (against raob 100-1000 hPa) Relative Humidity Temperature +1.5% +1% Better Better Worse AIRS Wind GOES Normalize Errors EN = (CNTL – EXP) CNTL Better May28-June04 2012 upper-air verification 100-1000 hPa RMS mean
24-h (2 X 12h) CPC Precipitation Verification CSI by precip threshold (avg. over eight 24h periods) Slight improvement for heavy precipitation thresholds from AIRS radiance data CNTL (no AIRS) AIRS Ex. 1 (default 120 channels AIRS Ex. 2 (selected 68 channels) May08-June16 2010
Sample Precipitation Impact CNTL vs. AIRS Ex. 2 24-h precip. verif CPC 24-h precip 2 x 12h fcst ending 12z 13 May 2010 Verified on common 20-km grid observed Miss FA Hit Thrs 1.5 CSI 0.13 1.5 ” theshold Thrs 1.50 CSI 0.22 CNTL AIRS Ex. 2
24-h (2 X 12h) Precipitation Verification CSI by precip threshold (avg. over eight 24h periods) CNTL (conventional data ) AIRS MHS HIRS Slight improvement for heavy precipitation thresholds from radiance data AMSU-A MHS data have largest positive impact for heavy precipitation prediction May08-June16 2010
Retrospective Experiments Set II (different data files) • Extensive retro run for bias coefficients spin up • Control run (CNTL) – (conventional data only) • 1-h cycling run, 8-day retro run (May 28 – June 4 2012) • RAP Hybrid EnKF system • Real-time radiance (limited availability) • CNTL + RAP real time radiance data (amsua/mhs/hirs4/goes) • Use updated bias coefficients from the extensive retro run • RARS + Real-time radiance (better availability) • (RARS = Regional ATOVS Retransmission Services) • Full coverage radiance (perfect availability) • The same as experiment two but using full data for amsua/mhs/hirs4 (no data latency)
Coverage comparison for the RARS data and the regular feed data Real-time radiance (limited availability) RARS + Real-time radiance (better availability) 18Z 19Z 08Z May 29 2012 amsua noaa-19
Impact from different data sets Temperature Relative Humidity +1.5% +2.5% Better Better Worse 18 HrFcst 18 HrFcst +3.5% Wind Real-time data Full data RARS included Normalize Errors EN = (CNTL – EXP) CNTL Better 18 HrFcst 100-1000 hPa RMS mean May28-June04 2012 retro runs
Impact from different data sets Temperature Relative Humidity +1.5% +2.5% Better Better Worse 18 HrFcst 18 HrFcst +3.5% Wind Real-time data Full data RARS included Init Hour 11,23z 9,21z 6,18z 3,15z 0,12z 18,6z Fcst length 1 3 69 12 18 Hrs since GFS 2 0 9 6 3 9 Better 18 HrFcst 100-1000 hPa RMS mean GFS partial cycle at 09z and 21z May28-June04 2012 retro runs
Precipitation Verification Stage 4 24-h precip Control vs. Radiance (RARS included) 2 x 12h fcst ending 12z 29 May 2012 observed Radiance Control 1.5” threshold Thrs CSI Bias 1.50 .30 0.37 Thrs CSI Bias 1.50 .24 0.33
Real-time RAP Experiments • Real-time RAP hybrid systems (RAP V2) on Zeus: • 1-h cycling with partial cycle • real-time data • 6 month time period • (Jun-July, Oct-Dec, 2013, Jan, 2014) • NO radiance • conventional data only • WITH radiance • conventional data + operational used radiance data (AMSU-A, HIRS4, MHS)
Real-time % improvement from radiance DA Relative Humidity Temperature +1% +1% Radisondeverification 6 month REAL-TIME test Wind +1% Init Hour 11,23z 9,21z 6,18z 3,15z 0,12z 18,6z Fcst length 1 3 69 12 18 Hrs since GFS 2 0 9 6 3 9 GFS partial cycle at 09z and 21z 100-1000 hPa RMS mean
6-h Forecast RMS Error Temperature Relative Humidity Worse Better Bet-ter Worse Wind upper-air verification Real-Time 6-month average (limited data coverage) WITH radiance NO radiance Worse Better
HRRR Radar reflectivity verification CSI vs. fcst length CSI (x100) 5 – 9 hr fcsts 40 dBZ 20 km scale Eastern US Forecast Length (h) CSI % improvement from radiance assim vs. valid time of day (all forecast lengths) -- 3 adjacent hourly values averaged to 3-hourly times Better % improvment CI Worse cycle convective 30 dBZ 20 km scale CONUS WITH RAP radiance NO RAP radiance Valid time (GMT) May 29 – June 04 2012 (34 HRRR retro runs)
Summary of radiance updates for RAP V3 • Included new sensors/data • GOES sounding data from GOES-15 • amsua/mhs from noaa-19 and metop-b; • Included the RARS data (Just on Zeus now) • Removed some high peaking channels to fit the model top of RAP and removed the ozone channels • Implemented the enhanced bias correction scheme with cycling Assimilation of satellite radiance data in morning RAP runs improving mesoscale environment, leading to slightly better HRRR forecasts of convective initiation and evolution
Conclusions • AIRS and GOES data have slightly positive impact • RAP real-time radiance data have slightly positive impact and the RARS data provide additional benefits • 6-month real time runs showed consistent positive impact (around 1%) from radiance data in RAP • Recommendations for RAP V3 updates (included)
Future work • Other new data (focusing on hyperspectral data) • -- ATMS and CrIS from NPP • -- IASI from metop-a/b • -- ABI from GOES-R • Increase RAP model top and model levels for better use of hyperspectral data in regional model and better bias correction (for experiment and research purpose) • Real-time data latency problem: • Partial cycle strategy • Use direct read out data
Assimilation of satellite retrieved soundings • Single Field of View (SFOV) clear sky soundings derived from CIMSS hyperspectral IR sounder retrieval (CHISR) algorithm (Li et al. 2000) Can use all channels in retrievals, but retrieved soundings very smooth Sample retrieved soundings compared to radiosondes Typical moisture and temperature biases for SFOV SFOV SFOV Raob Raob Dry Warm cold Less vertical structure in SFOV profiles
Diurnal aspects of SFOV T innovations (O-B) Mean SFOV T innovations – dependence on height, and time of day (horizontal and daily average) AK / Grnlnd Sample SFOV profiles compared with raobs Eastern NA Western NA/AK --- (north) Eastern NA Central NA Western NA/AK West of AK SFOV assimilation 400 -- 800 mb 00z 03z 06z 09z 12z 15z 18z 21z
Estimating fraction of data used short data cutoff times combined with long data availability latency timesleads to minimal satellite data availability Fraction of data used given by: W = Data Window Time L = Data Latency Time C = Data Cutoff Time (W/2 - L + C)/W obs used = 33% W = 180 min L = 60 min C = 30 min Sample case after cutoff data latency 0330z 0430z 0230z 0130z Diagram and equation following Steve Lord Obs time data available cutoff time 03z 04z 02z 05z 06z initial time data window
6-h Forecast RMS Error (against raob) Relative Humidity Relative Humidity Temperature Better Worse Bet-ter Worse Wind Wind upper-air verification CNTL Better Worse Satellite experiment one (real-time radiance data) May28-June04 2012
3-h Forecast RMS Error (against raob) Relative Humidity Temperature Worse Better Bet-ter Worse Wind upper-air verification CNTL May28-June04 2012 AIRS Worse Better
6-h Forecast RMS Error (against raob) Temperature Relative Humidity Bet-ter Worse Worse Better Wind upper-air verification CNTL May28-June04 2012 GOES Worse Better
Reflectivity Comparison Use 9Z + 6h fcst valid 15z 30 May 2012 example??? Observed radar composite reflectivity HRRR forecast reflectivity initialized from AIRS SFOV RAP run HRRR forecast reflectivity initialized from control RAP
Channel selection because of low model top Jacobian calculation in CRTM to find problem channels • The CRTM K-matrix model (Jacobian model) computes the radiance derivatives with respect to the input-state variables, such as temperature and gas concentration • Forward model • TL model • AD model • K-matrix model • is the input K-matrix radiance input variable and is the transpose of the ith row of the H matrix: • Setting for (i=1,….,m), the matrix returned from the K-matrix model contains the Jacobians The matrix H contains the jacobian element