1 / 1

Demonstration n°1 : Tracer Gas Study

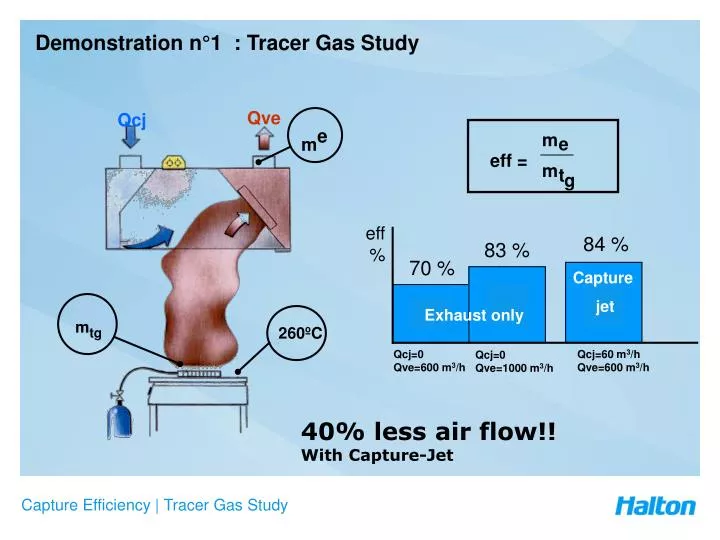
m. e. eff =. m. t. g. Demonstration n°1 : Tracer Gas Study. Qcj. Qve. m e. eff %. 84 %. 83 %. 70 %. Capture jet. Exhaust only. m tg. 260ºC. Qcj=0 Qve=600 m 3 /h. Qcj=60 m 3 /h Qve=600 m 3 /h. Qcj=0 Qve=1000 m 3 /h. 40% less air flow!! With Capture-Jet.

kina
Download Presentation

Demonstration n°1 : Tracer Gas Study

An Image/Link below is provided (as is) to download presentation Download Policy: Content on the Website is provided to you AS IS for your information and personal use and may not be sold / licensed / shared on other websites without getting consent from its author. Content is provided to you AS IS for your information and personal use only. Download presentation by click this link. While downloading, if for some reason you are not able to download a presentation, the publisher may have deleted the file from their server. During download, if you can't get a presentation, the file might be deleted by the publisher.

E N D

Presentation Transcript


  1. m e eff = m t g Demonstration n°1 : Tracer Gas Study Qcj Qve me eff % 84 % 83 % 70 % Capture jet Exhaust only mtg 260ºC Qcj=0Qve=600 m3/h Qcj=60 m3/h Qve=600 m3/h Qcj=0Qve=1000 m3/h 40% less air flow!!With Capture-Jet Capture Efficiency | Tracer Gas Study

More Related