Download
1 / 18
180 likes | 441 Views
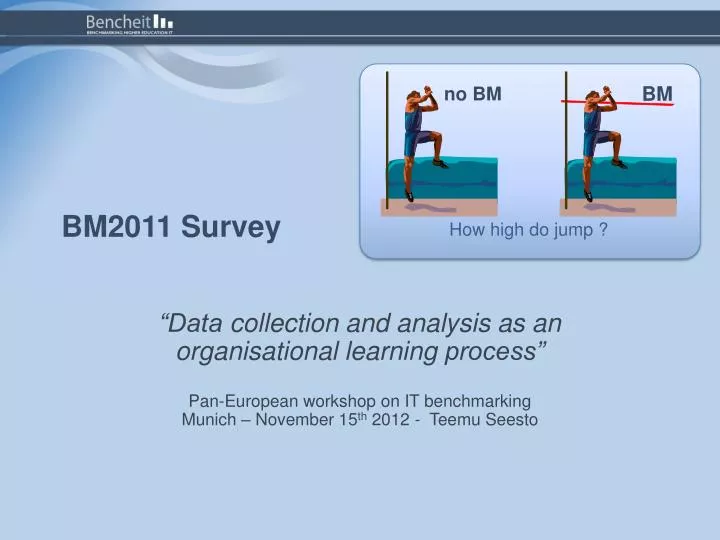
no BM. BM. BM2011 Survey. How high do jump ?. 1. “Data collection and analysis as an organisational learning process” Pan-European workshop on IT benchmarking Munich – November 15 th 2012 - Teemu Seesto. BM2011: “Know your numbers” *. Where are the numbers?

E N D
no BM BM BM2011 Survey How high do jump ? 1 “Data collection and analysis as an organisational learning process” Pan-European workshop on IT benchmarkingMunich – November 15th2012 - Teemu Seesto
BM2011: “Know your numbers” * • Where are the numbers? • How can I get the numbers? • What does these numbers tell about the institute? BM2011 / A learning process for an institute *Jussi-Pekka Pispa, CIO, Tampere University of Technology
BM2011: Where are the numbers? Hardware Software Staff Facilities Outsourcing Other scattered around the organisation Infrastructure Workstations - Workstations - Printing IT Service Desk Data networks: LAN & WAN Voice services - Telephony - Phone calls Business applications - Finance - Human resources - Facilities - Communications - Student administration systems - Research administration - Library - Teaching IT management Audio visual services Other IT-center Other centralized Distributed Account groups Organisational level Volumes CostAndFTE Services / Sub Services Background info BM2011 / A learning process for an institute
BM2011: Where are the numbers? Hardware Software Staff Facilities Outsourcing Other not necessarily allocated to any project or services Infrastructure Workstations - Workstations - Printing IT Service Desk Data networks: LAN & WAN Voice services - Telephony - Phone calls Business applications - Finance - Human resources - Facilities - Communications - Student administration systems - Research administration - Library - Teaching IT management Audio visual services Other IT-center Other centralized Distributed Account groups Organisational level Volumes CostAndFTE Services / Sub Services Background info BM2011 / A learning process for an institute
BM2011: Where are the numbers? Hardware Software Staff Facilities Outsourcing Other Infrastructure Workstations - Workstations - Printing IT Service Desk Data networks: LAN & WAN Voice services - Telephony - Phone calls Business applications - Finance - Human resources - Facilities - Communications - Student administration systems - Research administration - Library - Teaching IT management Audio visual services Other IT-center Other centralized Distributed Account groups Accounts in financial system does not match the BM account groups Organisational level Volumes CostAndFTE Services / Sub Services Background info BM2011 / A learning process for an institute
BM2011: Where are the numbers? Hardware Software Staff Facilities Outsourcing Other Infrastructure Workstations - Workstations - Printing IT Service Desk Data networks: LAN & WAN Voice services - Telephony - Phone calls Business applications - Finance - Human resources - Facilities - Communications - Student administration systems - Research administration - Library - Teaching IT management Audio visual services Other IT-center Other centralized Distributed Account groups Multiple or no information systems providing the numbers Organisational level Volumes CostAndFTE Services / Sub Services Background info BM2011 / A learning process for an institute
BM2011: How can I get the numbers? Volumes • Usually institute knows the amount of IT- hardware (and even software). • New technologies BM-questions may be hard to interpret. • But: • Floor space • Energy consumption Volumes CostAndFTE Background info University of Turku 20102011avgUNI # of physical servers 9477 149 BM2011 / A learning process for an institute
BM2011: How can I get the numbers? Costs • Usually IT-unit knows its costs. But what about IT in substance units? Volumes CostAndFTE University of Turku Background info BM2011 / A learning process for an institute
BM2011: How can I get the numbers? Costs • Balance sheet and accounts in bookkeeping does not match BM-categories. Volumes CostAndFTE several accounts and transactions had to be hand picked University of Turku # of accounts Hardware € 12 Software € 5 Staff costs € 25 Facilities € 17 Outsourcing € 7 Other€ 37 Background info SAP: 7.10.2011 533727,76€ 23 % 101700 IlluminaNetherlands BV 27.9.2011 22947,57€ 0 % 970100 AK 201109 BM2011 / A learning process for an institute
BM2011: How can I get the numbers? FTEs (Full Time Equivalent) • How to evaluate the amount of annual IT work* load? • Working time allocation system • A questionnaire • You know the people. • Based on salaries 90t€/year = 2 FTE Volumes CostAndFTE * ifunderstoodproperly Background info BM2011 / A learning process for an institute
BM2011: What does these numbers tell about the institute? Case University of Turku • 17000 bookkeeping transactions. • Bookkeeping (incl. investments) in different system than actual bill (cash flow). • No internal rent • No allocation of electricity/cooling costs to organisational units. • Almost half of the IT-work* is done elsewhere than within IT centre. * ifdefintionunderstoodproperly BM2011 / A learning process for an institute
BM2011: All institutes great and small Indicator (UTU): Max – Avg. – Min • Student FTE (12762): 23761– 6696 – 1170 • Staff FTE (3138): 7951 – 1374 – 154 • Running costs of institute (265M€):710M€ – 134M€ – 14M€ • Total IT-costs (12,8M€): 41M€– 6,9M€ – 0,7M€ • Number of logical servers (281): 1768 – 253 – 12 • Number of workstations (7300): 14685 – 3865 – 302 BM2011 / A learning process for an institute
BM2011: IT costs vs. institution’s costs Included account group(s): Hardware Software Outsourcing SAP+ ERP + library? BM2011 / A learning process for an institute
BM2011: Institution’s FTE vs. Centralized IT FTE BM2011 / A learning process for an institute
BM2011: Costs by Account group Account groups included: Hardware Software Outsourcing SAP+ ERP + library? IdM + storage BM2011 / A learning process for an institute
BM2011: Workstations Account groups included: Hardware Software Outsourcing Microsoft etc. licensesincluded BM2011 / A learning process for an institute
BM2011: “Lessons learned” • How can I get the numbers? • Background systems do not change hands on job + interpretations • Documentation of data collection. • For further surveys • For institute managers • What does these numbers tell about the institute? • Longitudinal tracking • Amongpeers BM2011 / A learning process for an institute
Benchmark 2011 Thank you! Teemu Seesto IT manager University of Turku Finland teemu.seesto@utu.fi Bencheit: http://www.bencheit.info BM2011 / A learning process for an institute