Download
1 / 12
120 likes | 264 Views
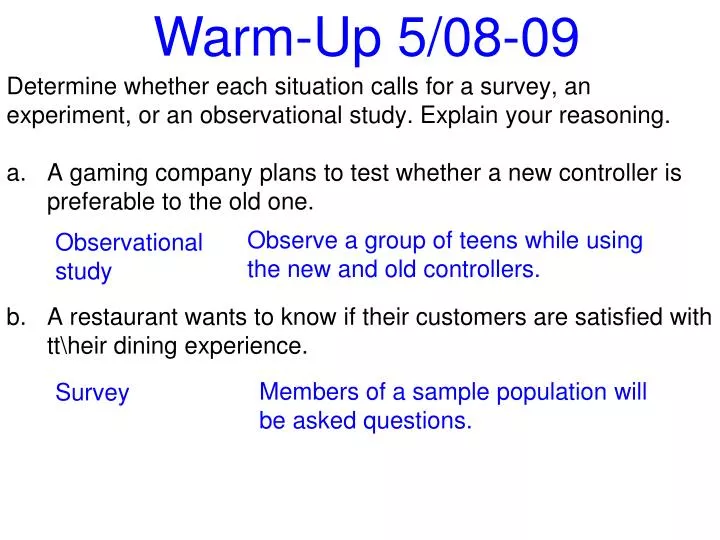
Warm-Up 5/08-09 . Determine whether each situation calls for a survey, an experiment, or an observational study. Explain your reasoning. A gaming company plans to test whether a new controller is preferable to the old one.

E N D
Warm-Up 5/08-09 Determine whether each situation calls for a survey, an experiment, or an observational study. Explain your reasoning. • A gaming company plans to test whether a new controller is preferable to the old one. • A restaurant wants to know if their customers are satisfied with tt\heir dining experience. Observe a group of teens while using the new and old controllers. Observational study Members of a sample population will be asked questions. Survey
Rigor:You will learn how to use shapes of distributions to select appropriate statistics and to compare data. Relevance:You will be able to analyze real world data by using shapes of distributions to select appropriate statistics and to compare data.
011-2 Distributions of Data
A distribution of data shows the observed or theoretical frequency of each possible data value. Key Concept: Symmetric and skewed Distributions • Mean median. • Data are majority on the right of the mean. • Mean Median. • Data are evenly distributed. • Mean median. • Data are majority on the left of the mean.
Choosing Appropriate Statistics Symmetric Distribution: use the mean and standard deviation. Skewed Distribution: use the five-number summary
Example 1: Describe a distribution using a histogram. Use a calculator to create a histogram and then describe the distribution. Describe the center and spread of the data. Prices for a random sample of personal computers Positively Skewed Distribution Press [2ND] (Y=) [STAT PLOT] [ENTER] [ENTER] and highlight Adjust window [0, 1000] scl: 100 by [0,10] scl:1 Press [STAT] [ENTER] and enter data values. [STAT] [►][ENTER] [ENTER] Skewed so use five-number summary to describe. Prices range from $374 to $915. Median price is $530.50. Half of the computers are priced between $451.50 and $665.
Key Concept: Box-and Whisker lots as Distributions • Data to the left of median are distributed over wider range than data to the right. • Data have a tail to the left. • Data are evenly distributed. • Data to the right of median are distributed over wider range than data to the left. • Data have a tail to the right.
Example 2: Describe a distribution using a Box-and-Whisker Plot. Use a calculator to create a box-and-whisker plotand then describe the distribution. Describe the center and spread of the data. Average number of minutes all students spent on homework each night. Symmetric Distribution Press [2ND] (Y=) [STAT PLOT] [ENTER] [ENTER] and highlight Adjust window [30, 75] scl: 5 by [0,5] scl:1 Press [STAT] [ENTER] and enter data values. [STAT] [►][ENTER] [ENTER] Symmetric so use mean and SD to describe. The average number of minutes was 53.5 with standard deviation of about 10.5. [▲] [CLEAR] [ENTER]
Example 3: Compare data using histograms. Use a calculator to create a histogram and then describe the distribution. Describe the center and spread of the data. Both distributions are symmetric. Symmetric so use mean and SD to describe. Chapter 3 mean is 81 with SD of about 9.9. Chapter 4 mean is 79 with SD of about 5.9. The mean of chapter 4 is a better representation of the data than the mean of Chapter 3.
Example 4: Compare data using Box-and-Whisker Plot. Use a calculator to create abox-and-whisker plot and then describe the distribution. Describe the center and spread of the data. Points scored per game by a professional football team. Use L1, Plot1 for 2008 and L2, plot2 for 2009. Adjust window [0, 55] scl: 5 by [0,5] scl:1 2008 distribution is negatively skewed. 2009 distribution is positively skewed. Skewed so use five-number summary to describe. [STAT] [►][ENTER] [2nd] [2] [ENTER] 2009 minX= 3 Q1= 6.5 med = 11.5 Q3 = 20.5 maxX = 41 2008 minX= 7 Q1= 20.5 med = 27 Q3 = 30 maxX = 51 75% of 2008 scores > 20.5 while 75% of 2009 scores < 20.5. 25% of 2009 scores < any 2008 score so the team scored higher amount of points in 2008.
Assignment Prob/Stats #6 WS, 1-9 all