Download
1 / 12
120 likes | 228 Views
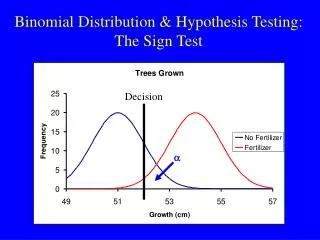
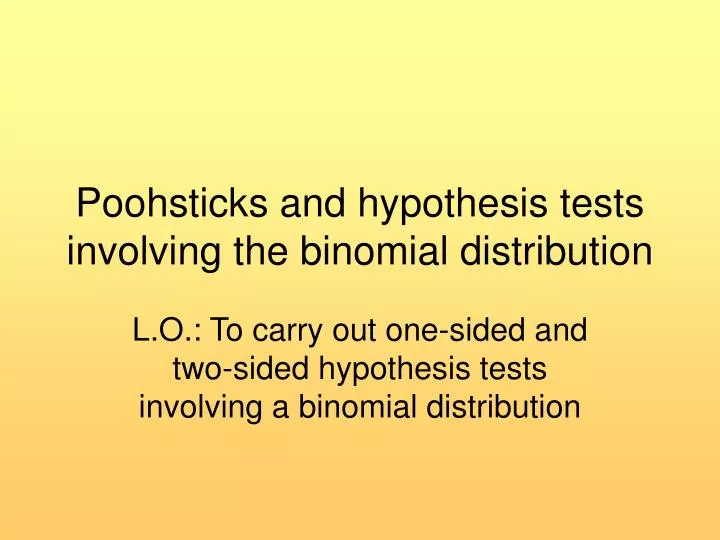
Poohsticks and hypothesis tests involving the binomial distribution. L.O.: To carry out one-sided and two-sided hypothesis tests involving a binomial distribution. The House at Pooh Corner (by AA Milne).

E N D
Poohsticks and hypothesis tests involving the binomial distribution L.O.: To carry out one-sided and two-sided hypothesis tests involving a binomial distribution
The House at Pooh Corner (by AA Milne) Pooh believes that he is able to predict which of two fir-cones will emerge first from under a bridge in a game of poohsticks. To see whether he is right, he devises a simple experiment in which he plays the game of poohsticks 12 times. He is able to correctly predict the winning fir-cone on 10 of these occasions. Test whether Pooh seems able to predict the winning fir cone using a 5% significance test.
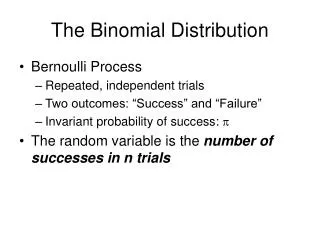
The House at Pooh Corner (by AA Milne) H0: p = 0.5 H1: p > 0.5 5% significance test Let X be the number of correct predictions. Under H0, X ~ B(12, 0.5). P(X ≥ 10) = 1 – P(X ≤ 9) = 1 – 0.9807 = 0.0193 or 1.93% As 1.93% < 5%, we can reject H0. There is evidence that Pooh has some ability to predict the winning fir-cone. This probability is called the p-value.
One-sided and two-sided hypothesis tests Example: A drug is claimed to have a 40% success rate for curing patients with a certain disease. This is suspected of being an exaggeration. To test this claim, 16 people were treated with one drug and it was found that 3 were cured. Carry out a test at the 10% significance level. Solution: H0: p = 0.4 H1: p < 0.4 10% significance test Let X be the number of people cured. Under Ho, X ~ B(16, 0.4) P(X ≤ 3) = 0.0651 or 6.51% (from tables). Since 6.51% < 10%, we can reject H0. There is weak evidence that the claimed success rate is exaggerated.
One-sided and two-sided hypothesis tests Compare this example to the following slightly differently worded question:-
One-sided and two-sided hypothesis tests Example: A drug is claimed to have a 40% success rate for curing patients with a certain disease. A doctor wishes to test whether this success rate is correct. The doctor gives the drug to 16 patients and finds that 3 are cured. Carry out a hypothesis test using a 10% level. Notice that we have the same data as before, i.e. 16 patients, 3 cured. However the hypotheses are now different: H0: p = 0.4 H1: p ≠ 0.4 This test is now called a two-sided (or two-tailed) test. We are essentially testing two different hypotheses, i.e. whether p < 0.4 and p > 0.4. We use a 5% significance level for each test. Note: we are not indicating whether the success rate is believed to be too high or too low.
One-sided and two-sided hypothesis tests Solution: H0: p = 0.4 H1: p ≠ 0.4 10% significance test Let X be the number of people cured. Under Ho, X ~ B(16, 0.4) P(X ≤ 3) = 0.0651 or 6.51% (from tables). Since 6.51% > 5%, we cannot reject H0. There is no evidence that the claimed success rate is incorrect.
One-sided and two-sided hypothesis tests Example: A magazine claims that 35% of all adults wear glasses. Anna wishes to test whether this figure is correct. She takes a sample of 18 adults and notices that exactly 13 of them wear glasses. Test at the 5% level whether the magazine claim is accurate. Solution: H0: p = 0.35 H1: p ≠ 0.35 (two-sided) Significance level: 5% Let X = number of people wearing glasses in sample.
One-sided and two-sided hypothesis tests Under Ho, X ~ B(18, 0.35). P(X ≥ 13) = 1 – P(X ≤ 12) = = 1 – 0.9986 = 0.0014 or 0.14% As this test is two-sided we compare this probability with 2.5%. As 0.14% < 2.5%, we can reject H0. We have some evidence that the proportion of adults wearing glasses is not 35%.
Use of a normal approximation Example: There are many complaints from passengers about the late running of trains on a particular route. The railway company claims that the proportion of trains that are delayed is 10%. The Railway Passengers’ Association conducts a survey of a random sample of 200 trains and finds that 27 are delayed. Test at the 5% level whether the railway company is underestimating the proportion of trains that are delayed.
Use of a normal approximation Solution: H0: p = 0.1 H1: p > 0.1 (one-sided test) Significance level: 5% Let X be the number of trains in the sample that are delayed. Under H0, X ~ B(200, 0.1). But X ≈ N[200 × 0.1, 200 × 0.1 × 0.9] = N[20, 18]. P(X ≥ 27) = P(X ≥ 26.5) = Continuity correction
Use of a normal approximation Conclusion: Since 6.28% > 5%, we cannot reject H0. There is no evidence that the train company is understating the proportion of delayed trains.