Download
1 / 29
300 likes | 307 Views
Availability – LiDAR/DEMs. As of 28 April 2013 Ortho Program Index Pink Counties have Mosaic and Tiles Orange Counties -Tiles only White Counties no data yet Problems with 2012 counties – 12 counties need re-flown Foliage blossomed too soon Ground conditions Snow

E N D
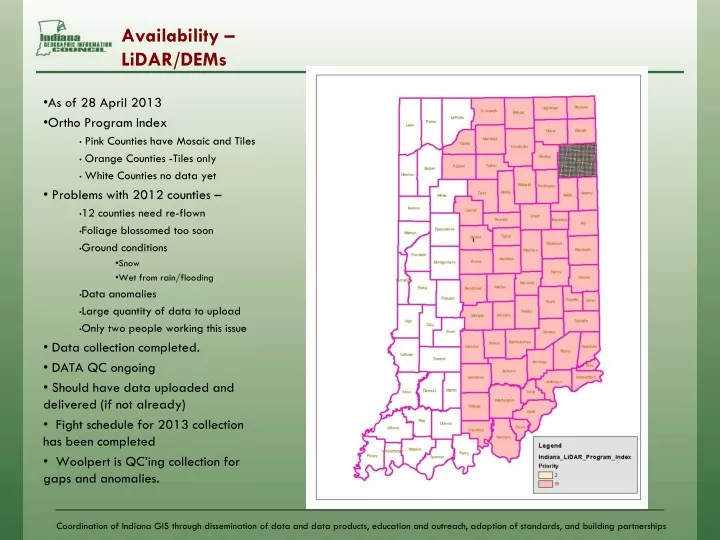
Availability – LiDAR/DEMs As of 28 April 2013 Ortho Program Index Pink Counties have Mosaic and Tiles Orange Counties -Tiles only White Counties no data yet Problems with 2012 counties – 12 counties need re-flown Foliage blossomed too soon Ground conditions Snow Wet from rain/flooding Data anomalies Large quantity of data to upload Only two people working this issue Data collection completed. DATA QC ongoing Should have data uploaded and delivered (if not already) Fight schedule for 2013 collection has been completed Woolpert is QC’ing collection for gaps and anomalies.
Statewide Imagery Project - Ortho & LiDAR 2011 2012 2013
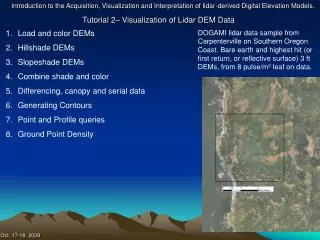
Vertical Accuracy TestingUse Existing Data • We need Confidence in the data - • Using what we have, we can with a little effort - • Using Projects from 2007 – 2010 • Mostly from Work Done for FEMA MapMod Projects • In Various Locations Around the State • In One Location, More or Less in a County • We turn to the standards -
Reference Documents on IGIC Website Documents are posted on IGIC website: • http://www.igic.org/projects/lidar/IGIC-Horizontal and Vertical Accuracy Assessment Template2.xls • Template spread sheet for testing LiDAR elevations to survey points • Math set up • http://www.igic.org/projects/lidar/FGDC_NSSDA_Chapter3.pdf • Standards for testing LiDAR elevations to survey points for confidence level • http://www.igic.org/projects/lidar/NDEP_Elevation_Guidelines_Ver1_10May2004.pdf • Guidelines/recommendations for acquiring digital elevation data • Many of the various forms of Elevation data covered. • http://www.igic.org/projects/lidar/USGS_Ver1.0_TM11-B4.pdf • Guidelines/recommendations for acquiring LiDAR Base data
IGIC - Indiana GIS LiDAR Applications for Surveyors Accuracy and Limitations of using LiDAR, DEM and Derivative Products FGDC Metadata [and Published Accuracy] for Indiana’s LiDAR & DEM data products IN_2011_Statewide_East_LAS.txt IN_2011_Statewide_West_LAS.txt IN_2011_Statewide_East_IMG_DEM.txt IN_2011_Statewide_West_IMG_DEM.txt IN_2011_Statewide_East_Breakline.txt IN_2011_Statewide_West_Breakline.txt Published Accuracy:The LiDAR data vertical accuracy RMSE is Block 1 - 5.699 cm (0.187 ft), Block 2 - 7.345 cm (0.241 ft) and Block 3 - 6.553 cm (0.215 ft). The data collected under this Task Order meets the National Standard for Spatial Database Accuracy (NSSDA) accuracy standards.
NSSDA Test National Standard for Spatial Data AccuracyIssued by FGDC in 1998 http://www.fgdc.gov/standards/projects/FGDC-standards-projects/accuracy/part3/chapter3
NSSDA • Objective The National Standard for Spatial Data Accuracy (NSSDA) implements a statistical and testing methodology for estimating the positional accuracy of points on maps and in digital geospatial data, with respect to georeferenced ground positions of higher accuracy.
Testing Methodology – NSSDA requirements • Data Producer will determine Geographic extent of testing area. • 20 points required for area. • Point placement • Better to spread through entire area • Evenly dispersed in four quadrants • 10% across entire length of box • *Will require points in different land-use areas • Concentration can be heavier in specific areas • User can concentrate more points in specified area when warranted by job requirements.
Set-up and requirements • Ground Truth • Current survey level line points • Ground points • Exclude elevated points • Exclude subsurface points • Make sure nothing has changed since survey • Repaving on roads • Grading/excavation of area • DEM • Software – • ArcMap 10.0 or higher • 3d Analyst extension
DNR - Vertical Accuracy TestingUsing Existing Data Projects from 2007 – 2010 Mostly from Work Done for FEMA MapMod Projects In Various Locations Around the State In One Location, More or Less in a County
Vertical Accuracy TestingHaw Creek 2010 Data 2003 Data not used in NSSDA Test Road surface had been repaved.
Haw Creek 2010 Data Project from 2010 May have been some changes between survey and LiDAR - Road resurfaced, erosion, Cut/fill areas Data checked to be current 3422 Total Points Too many points. NSSDA only requires 20 Some points on guardrails, bridge low structure etc. not suitable for checking LiDAR data.
Testing Methodology • Data Producer will determine Geographic extent of testing area. • 20 points required for area. • Point placement • Better to spread through entire area • Evenly dispersed in four quadrants • 10% across entire length of box • *Will require points in different land-use areas • Concentration can be heavier in specific areas • User can concentrate more points in specified area when warranted by job requirements. • Survey elevation data must be higher quality than testing LiDAR to. • Level Lines at 3rd order • GPS collection – Static GPS
Points Needed for Modeling BridgeHEC-RAS 99 Total Points
Typical Bridge Section Points on Road surface Channel points are underwater Cannot be used as LiDAR has no data!
Weeded Down to 3 Points Down to three points to reflect this area These points represent the area of the survey and are spread across our general area. Points represent ground elevations. For county wide we will points spread across the county, in different land-use areas, and evenly spaced. Left number is elevation from surveys Right number is elevations from DEMs Very close. Possible issues between data sets – Road resurface Cut/Fill areas Erosion New construction
Results of Weeding Down Points • 3428 Points were Weeded down to about 210 Points. • Several more points weeded by looking at their attributes to confirm that they were not ground points. 203 Points Remain.
Hydro Flattening. • HYDRO FLATTENING: • Concerns when using data around water features. • Potential loss of some data. • Only the DEM’s derived from the LAS files. • Breaklines digitized from the LAS files. • Point clouds are not as sharp as the orthophotos. • A little bit of land may accidently get flattened while a little bit of water may not. • Should now be just ± 10 feet.
Add LiDAR Value to Point File with ArcMap Changed to “LiDAR_Spot” in attribute table
Attribute Table Z value from DEM
Check Statistics in ArcMap Most errors fell between -0.4 and 0.6
NSSDA Test in Excel Example – subset of actual E – D = F F 2 From Statistics Average of G Square Root of MSE NSSDA at 95% Confidence Level is RMSE times 1.96
NSSDA Test Results – 2011 DEMs • Bartholomew – 0.58 ft. • Brown – 0.67 ft. • Boone – 0.32 ft. • Cass – 0.47 ft. • Clinton – 0.33 ft. • Elkhart – 0.81 ft. • Howard – 0.30 ft. • Johnson – 0.47 ft. • Monroe – 0.72 ft. • Morgan – 0.23 ft. These test results – 2011 DEMs - Specific for stream crossings - Not for entire county - Very small portions of county We need to establish confidence levels for data county wide! I NEED MORE POINTS THROUGHOUT THE COUNTIES!!!!!!!
Accuracy Reporting • Will be included in index Metadata – • Index will be shapefile designed to visually depict area checked. • Shapefile attributed with pertinent data • Vertical datum • Date of check • Check performed by • Example in metadata - • 0.58 ft. at a 95% confidence level, derived according to NSSDA, i.e., based on RMSE of 0.30 ft. in the open terrain land cover category (Note USGS V1.2 Specification). • If less than 1.2ft, you can create 2 foot contours with confidence. • Looking into a certification letter for all this data! • Still muddling through the process for letter
Index for Accuracy Reporting • IGIC would like to create a tracking system for public use that visually shows where LiDAR data has been checked against survey data. • Using qualified survey data, either previously collected or specifically collected for running elevation checks: • Be willing to run checks through the process • Be able to describe the reasoning behind how the process was done with used points. • Be willing to share data sheets and description of area checked to IGIC (free of charge).
FOR THE REST OF THE STORY • Conducting a Vertical Accuracy Assessment of Statewide LiDAR Data to support local projects – • Wednesday, 1300 - 1335 • That’s 1pm for civilians • Mississinewa Room • In-depth discussion of this subject