Download
1 / 36
360 likes | 366 Views
This study explores the importance of galaxy clusters for abundance studies, the challenges in observing and analyzing the data, and the enrichment processes through supernovae and winds. Conclusions include the quantification of systematic uncertainties and the implications for iron and oxygen profiles.

E N D
The chemical enrichment of clusters of galaxies Jelle S. Kaastra Collaborators: Norbert Werner, Jelle de Plaa, Aurora Simionescu, Yan Grange
Outline • Importance clusters • Observational challenges • Enrichment by supernovae • Enrichment by winds • Conclusions
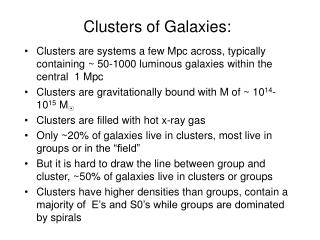
1. Importance clusters for abundance studies • Largest bound structures • Deep potential wells, retains most of the gas • Hot gas: no significant “hiding” of metals in dust • Spatial extent allows mapping
2. Observational challenges • Fe bias • Non-thermal components • Complex temperature structure
The Fe bias Multi-T 1T • 1T models sometimes too simple: e.g. in cool cores • Using 1T gives biased abundances (“Fe-bias, Buote 2000) • Example: core M87 (Molendi & Gastaldello 2001)
Non-thermal components • Example: Sérsic 159-03 • Strong soft excess, modeled by non-thermal component • Implications on abundances (De Plaa et al. 2006)
Complex temperature structure I(de Plaa et al. 2006) • Sérsic 159-3, central 4 arcmin • Better fits 1Twdemgdem • Implication for Fe: 0.360.350.24 • Implication for O: 0.360.300.19
Inverse iron bias: how does it work? • Simulation: 2 comp, T=2 & T=4 keV, equal emission measure • Best fit 1-T gives T=2.68 keV • Fitted Fe abundance 11 % too high • Due to different emissivity for Fe-L, Fe-K
Complex temperature structure II(Simionescu et al. 2008) • Example: Hydra A • Central 3 arcmin: • Full spectrum: Gaussian in log T (σ=0.2) • 1T fits individual regions: also Gaussian • Confirmed by DEM analysis (blue & purple)
Implications for Fe abundance(Simionescu et al. 2008) Central 3 arcmin Hydra A, 1T models: (errors on Fe 0.01 to 0.02)
Fitting bias: continua ok?(Werner et al. 2006) • Some features subtle • Example: 2A0335+096, 130 ks XMM-Newton • To determine Cr abundance (0.5±0.2 solar) needs carefull analysis local continuum
Fitting bias: calibration uncertainties(de Plaa et al. 2007) • Some lines (Si) weaker than calibration uncertainty instruments • Important to estimate systematic uncertainties (no “blind” χ2 fitting) Diffference pn data & best-fit MOS model Sérsic 159-03
Quantifying systematics(de Plaa et al. 2007) • Correction: fudge MOS area to match pn and vice versa (spline) • Remaining difference systematic: • Mg: too uncertain • Si: 11 % • Ni: 19 % Example: Sérsic 159-03
Decomposing abundances into SN types(De Plaa et al. 2006) • Deep exposure XMM-Newton Sérsic 159-3 • Data include RGS • ~50 % SN Ia by number • Ca problem
Another case: 2A 0335+096(Werner et al. 2006) • Use here WDD model • Central 3 arcmin: • Sn Ia: 25 % • Increases to 37 % in 3-9 arcmin annulus • Ni: W7 model predicts more • Also here Ca problem
Analysis of a large sample (De Plaa et al. 2007) • 22 clusters, 685 ks net exposure • Taken from HIFLUGCS sample (Reiprich & Böhringer 2002) • All spectra extracted from within 0.2 R500 • Use wdem model
Solution to the Ca problem(De Plaa et al. 2007) • Also sample shows Ca excess • Problem solved by adopting SN Ia yields based on Tycho SNR (Badenes et al. 2006) • Best fit Ia/(Ia+cc) number ratio: 0.44±0.05 WDD Tycho
A 2052(Grange et al. 2008) • 90 ks exposure (2001, 2007) • Analysis in progress • Abundances O to Fe all consistent with sample De Plaa et al. (2007) • Only Ca more overabundant: Ca/Fe = 1.51±0.10 (compared to 1.03, σ=0.12) • Needs further confirmation
Comparison between clusters(Simionescu et al. 2008) • 6 clusters with deep exposures, taken from literature • Most have 30-40 % contribution Ia • Hard to discriminate between Ia models, but see extremes Hydra A / M87
Radial profiles: example 2A 0335+096(Werner et al. 2006) S Si Ar Fe
Comparison between clusters: radial profiles(Simionescu et al. 2008) • All elements have decreasing abundances • Also valid for O (contrary to earlier suggestions of flat O profile, Tamura et al. 2004)
Abundance ratios constant?(Simionescu et al. 2008) • Si/Fe flat within 0.1 R200, maybe break at 0.05R200 • O/Fe increases, but only slightly: per dex in radius, O/Fe increases by 0.25±0.09 (Fe decreases by 0.72) O/Fe Si/Fe
Consequences of “flat” oxygen profiles(Simionescu et al. 2008) • Flattish O profiles: not only Ia contribute to core enrichment • Ram pressure stripping works already at Mpc scale (compare to 130 kpc core Hydra A) • Continued cc SN activity over past 1010 year? • Early central enrichment cc SN?
XMM-Newton RGS results • RGS optimal for point sources • But still the best for moderately extended sources: • Δλ (Å) = 0.138 Δθ (arcmin)
RGS results: M 87(Werner et al. 2006) • Exposure time: 169 ks • Lines from O, N, & C • C/Fe: 0.74±0.13 • N/Fe: 1.62±0.21 • O/Fe: 0.59±0.04 • Ne/Fe: 1.25±0.12 • Mg/Fe: 0.60±0.06 • Fe: 1.06±0.03 • AGB winds for CN! Continuum-subtracted RGS spectrum
Nitrogen with RGS: other cases • M87: N/Fe = 1.62±0.21 • 2A 0335+096 (Werner et al. 2006): 1.3±0.4 • Sérsic 159-3 (De Plaa et al. 2006): 0.0±0.5 • Centaurus (Sanders et al. 2008): 1.5-3 • Need for more deep exposures with RGS
Other case: Centaurus(Sanders et al. 2008) N/Fe=1.5-3
5. Conclusions • XMM-Newton observations of clusters of galaxies can disentangle contributions different SN types and winds • Need take care of systematics, in particular temperature distribution for reliable results • Best done using deep exposures