Download
1 / 13
180 likes | 340 Views
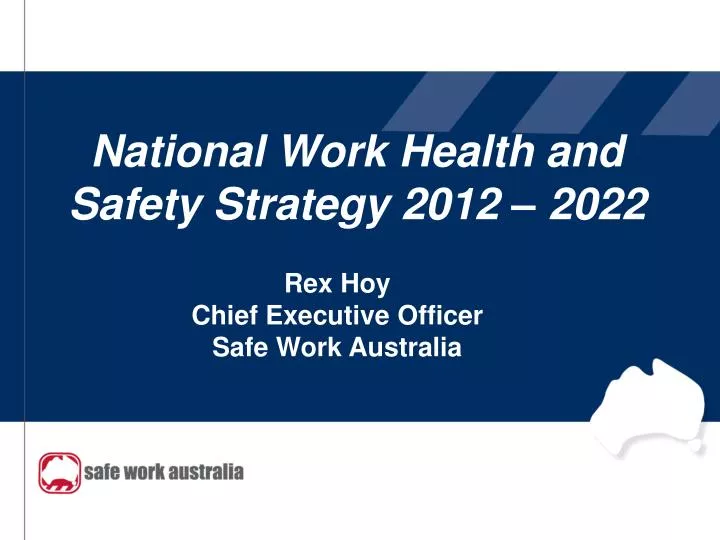
National Work Health and Safety Strategy 2012 – 2022. Rex Hoy Chief Executive Officer Safe Work Australia. Improving industry performance - Australia. Workers’ compensation claims per thousand employees – Priority Industries. Reducing injuries - Australia.

E N D
National Work Health and Safety Strategy 2012 – 2022 Rex Hoy Chief Executive OfficerSafe Work Australia
Improving industry performance - Australia Workers’ compensation claims per thousand employees – Priority Industries
Reducing injuries - Australia workers’ compensation claims per thousand workers which were due to injuries and musculoskeletal damage Workers’ compensation claims for injuries and musculoskeletal damage per thousand workers
National Strategy implementation ̶ political and organisational changes Some loss of focus in current National Strategy due to • organisational restructures (change from NOHSCto ASCC and to Safe Work Australia) • changing political context
Implementation problems • Implementation planning patchy or absent • Lack of clarity about roles and responsibilities • Roles for social partners not clear • Poor coordination of efforts • Variable resourcing levels • Loss of momentum in • Occupational diseases • Skills • Safe design
Work Health and Safety data in 2011 National data sources continuously improved • Good data on traumatic fatality • Good data in traumatic injuries • Good ‘high level’ data on performance in our priority industries • Better data on hazard exposures • Better data on attitudes and perceptions to work health and safety • Good mesothelioma data but • Poor data on health outcomes for long latency occupational diseases • Relatively poor data on sub-industries and occupations • Relatively poor data on workers who are not covered by workers’ compensation • Poor lead indicator data • Poor link between effectiveness of specific national actions and outcomes - what works for whom, where, when and why
More accurate and sophisticated performance reporting • Comparison of OHS Arrangements in Australia and New Zealand • Notified Fatalities Statistical report • Comparison of Workers’ Compensation Arrangements in Australia and New Zealand • Compendium of Workers’ Compensation Statistics • Cost of work-related injury and illness
Research in 2011 Research agenda and activity expanded and refined - greater focus on data to inform potential lead indicators • Hazard exposure surveillance – focus on those causing disease • Measured exposures studies • Regulatory research • Intervention effectiveness • Surveys on work health and safety motivations, attitudes and skills • Improved national research collaborations (ARC, CRCs) • Emerging issues surveillance • Rehabilitation and return to work Increased commitment to evaluation but capability still evolving • Measuring nationally harmonised regulatory framework and activity • Currently designing a possible and achievable measurement framework