Download
1 / 17
170 likes | 427 Views
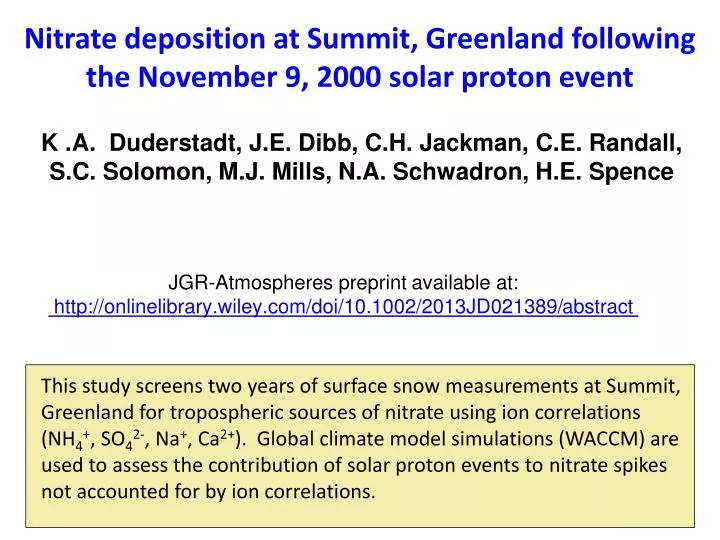
Nitrate deposition at Summit, Greenland following the November 9, 2000 solar proton event . K . A. Duderstadt , J. E. Dibb, C. H. Jackman, C. E. Randall, S. C. Solomon, M. J. Mills, N. A. Schwadron , H.E. Spence.

E N D
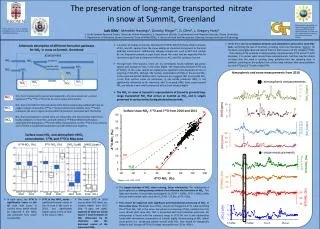
Nitrate deposition at Summit, Greenland following the November 9, 2000 solar proton event K.A. Duderstadt, J.E.Dibb, C.H.Jackman, C.E.Randall, S.C.Solomon, M.J.Mills, N.A. Schwadron, H.E. Spence This study screens two years of surface snow measurements at Summit, Greenland for tropospheric sources of nitrate using ion correlations (NH4+, SO42-, Na+, Ca2+).Global climate model simulations (WACCM) are used to assess the contribution of solar proton events to nitrate spikes not accounted for by ion correlations. JGR-Atmospheres preprint available at: http://onlinelibrary.wiley.com/doi/10.1002/2013JD021389/abstract
A stable polar vortex isolates air. NOx diabatically descends over winter pole. Polar Night
Nitrate spikes in Summit snow (2000-2002) not accounted for by soluble ion correlations. (Candidates for SPE events) 22 Oct 22-24 Nov 13 Dec 25 Jan Solar Proton Events Nov 22 Nov 9 Sep 24 Nov 4 Focus WACCM simulations on Nov 22-24, Dec 13,and Jan 25, spikes occurring in polar winter that are not attributed totropospheric sources.
9 November 2000 SPE (WACCM) Slow downward transport
9 November 2000 SPE (WACCM) SPE enhancement < 5% SPE enhancement (5% vortex-averaged and 20% local maxima) is notlarge enoughto explain the 4-5 fold spikes in nitrate ions in snow and ice.
Consider the largest SPE in past 50 years… • Sep-Oct 1989 SPEs placed in a stable polar vortex winter (2004-5)• 10 times Sep-Oct 1989 SPEs placed in 2004-2005 10% 60-70% • NOyenhanced by ~10%(maximum local 20%) with Sep-Oct 1989 SPEs. • NOyenhanced by 60-70%(maximum local 100%) with 10x Sep-Oct 1989 SPEs • Total column NOy enhancement not sufficient to explain 4-5 fold nitrate spikes at the surface.
1989 Sep-Oct SPEs in 2004-2005 winter Vortex-averaged NOy 10x 1989 SPEs enhancement Background 5-15 ppbvNOy in lower stratosphere. Peak number density occurs below 20 km Thin layer of enhanced NOy around 30-35km. 10-20 ppbvfor Sep-Oct 1989 SPEs > 50 ppbvfor 10x Sep-Oct 1989 SPEs
Sep-Oct 1989 SPEs in 2004-2005 winter and 10x Sep-Oct 1989 SPEs 2 orders of magnitude 50% increase WACCM Jan 5, 2005 Large SPE enhancements of NOy in the mesosphere and upper stratosphere have limited impact on cumulative column density.
Conclusions SPEs significantly increase reactive nitrogen and decrease ozone in the stratosphere following November 2000 events. Noconvincing evidence that SPEs are related to impulsive nitrate spikes. Tropospheric sources provide an alternative explanation for nitrate spikes at Summit during the winter of 2000-2001. Remaining Questions • How large would an SPE have to be to produce discernable nitrate spikes at the surface, given the limits of solar flare energy? • Longer-term variations in nitrate related to solar activity continue to be of interest (Gleissberg cycles, millennial variations, etc.). • Are there alternative proxies for SPEs? On what timescale can cosmogenic radionuclides (e.g., 14C and 10Be) or other isotopes be used to study solar variability?
References Computational and Information Systems Laboratory. 2012. Yellowstone: IBM iDataPlex System (University Community Computing). Boulder, CO: National Center for Atmospheric Research,http://n2t.net/ark:/85065/d7wd3xhc.. Dibb, J. E., S. I. Whitlow, and M. Arsenault (2007), Seasonal variations in the soluble ion content of snow at Summit. Greenland: Constraints from three years of daily surface snow samples, Atmos. Environ., 41(24), 5007–5019, doi:10.1016/j.atmosenv.2006.12.010. Garcia, R. R., D. R. Marsh, D. E. Kinnison, B. A. Boville, and F. Sassi (2007), Simulation of secular trends in the middle atmosphere, 1950–2003, J. Geophys. Res., 112, D09301, doi:10.1029/2006JD007485. Jackman, C. H. et al. (2008), Short- and medium-term atmospheric constituent effects of very large solar proton events, Atmos. Chem. Phys., 8(3), 765–785, doi:10.5194/acp-8-765-2008. Jackman, C. H., D. R. Marsh, F. M. Vitt, R. R. Garcia, C. E. Randall, E. L. Fleming, and S. M. Frith (2009), Long-term middle atmospheric influence of very large solar proton events, J. Geophys. Res., 114, D11304, doi:10.1029/2008JD011415. Lamarque, J.-F. et al. (2012), CAM-chem: description and evaluation of interactive atmospheric chemistry in the Community Earth System Model, Geosci. Model Dev., 5(2), 369–411, doi: 10.5194/gmd-5-369-2012. McCracken, K. G., G. A. M. Dreschhoff, E. J. Zeller, D. F. Smart, and M. A. Shea (2001a), Solar cosmic ray events for the period 1561-1994: 1. Identification in polar ice, 1561-1950, J. Geophys. Res., 106(A10), 21585–21598, doi:10.1029/2000JA000237. Wolff, E. W., M. Bigler, M. A. J. Curran, J. E. Dibb, M. M. Frey, M. Legrand, and J. R. McConnell (2012), The Carrington event not observed in most ice core nitrate records, Geophys. Res. Lett., 39, L08503, doi:10.1029/2012GL051603. Zeller, E. J., and G. A. M. Dreschhoff (1995), Anomalous nitrate concentrations in polar ice cores—Do they result from solar particle injections into the polar atmosphere? Geophys. Res. Lett., 22, 2521–2524, doi:10.1029/95GL02560.
Correlations among nitrate (NO3-), ammonium (NH4+), and sulfate (SO42-) identify biomass burning and anthropogenic pollution sources. NH4+ (ammonium) Biomass Burning SO42- (sulfate) Anthropogenic Pollution
Correlations among nitrate (NO3-), sodium (Na+), and calcium (Ca2+) identify sea salt and dust sources. Na+ (sodium) Sea Salt Ca2+ (calcium) Dust
SPE impact on WACCM model Nov-March vortex average NOx and O3 Nov 9 SPE 10-20x 5-10% 2-3x • NOx enhancements of 10-40 ppbv (10-20x background levels) descend at rate of ~10 km/month. By January, NOx enhancements are 3-5 ppbv (2-3 times background levels) at 30-35 km. • O3 reduction of 400-500 ppbv (5-10%) persist until spring. [Enhancements at 30-35 km are above the ozone layer peak at 15-20 km.]
POAM III satellite comparisons show that WACCM does a good job simulating NO2 levels when including SPE enhancements.
SPEs have less than 0.2% effect on wet deposition of nitrate. SPEs produce negligible difference WACCM captures peaks of interest on 22-24 Nov, 14 Dec, and 25 Jan. (The overestimate in magnitude is due to the assumption of instantaneous loss from the entire atmospheric column as well as the coarse model grid.)
WACCM shows polluted plumes from North America and Europe reaching Summit during periods of nitrate enhancement.