Download

1 / 16
160 likes | 259 Views
Solving LP Problems in a Spreadsheet. A company sells two models of hot tubs: the Aqua-Spa and the Hydro-Lux.

E N D
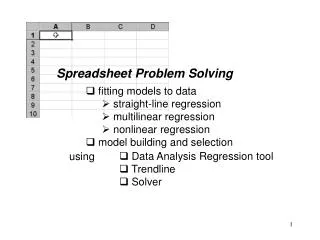
Solving LP Problems in a Spreadsheet • A company sells two models of hot tubs: the Aqua-Spa and the Hydro-Lux. • The company purchases prefabricated fiberglass hot tub shells and installs a common water pump and the appropriate amount of tubing into each hot tub. Every Aqua-Spa produced can be sold to generate a profit of $350, and each Hydro-Lux produced can be sold to generate a profit of $300. • Every Aqua-Spar requires 9 hours of labor and 12 feet of tubing; every Hydro -Lux requires 6 hours of labor and 16 feet of tubing.
The company expects to have 200 pumps, 1,566 hours of labor, and 2,800 feet of tubing available during the next production cycle. • The problem is to determine the optimal number of Aqua-Spas and Hydro-Luxes to produce in order to maximize profits.
MAX: 350X1+ 300X2 } profit Subject to: 1X1 + 1X2< 200 } pump constraint 9X1 + 6X2< 1,566 } labor constraint 12X1 + 16X2 < 2,800 } tubing constraint 1X1> 0 simple lower bounds 1X2> 0 for the decision variables
Implementing an LP Model in a Spreadsheet • 1. Organize the data for the model on the spreadsheet. • First, the goal is to organize the data so their purpose and meaning are as clear as possible. • Descriptive labels should be placed in the spreadsheet to clearly identify the various data elements. • 2. Reserve separate cells in the spreadsheet to represent each decision variable in the algebraic model. • This is often helpful in setting up formulas for the objective function and constraints. • When possible, it is also a good idea to keep the cells representing decision variables in the same area of the spreadsheet.
3. Create a formula in a cell in the spreadsheet that corresponds to the objective function in the algebraic model. • The spreadsheet formula corresponding to the objective function is created by referring to the data cells where the objective function coefficients have been entered (or calculated) and to the corresponding cells representing the decision variables. • 4. For each constraint in the algebraic model, create a formula in a cell in the spreadsheet that corresponds to the left-hand-side (LHS) of the constraint. • The formula corresponding to the LHS of each constraint is created by referring to the data cells where the coefficients for these constraints have been entered (or calculated) and to the appropriate decision variable cells.
Decision Variables: X1 X2 Spreadsheet Cells: B4 C4 Algebraic Objective: 350 X1+300 X2 Formula in cell E5: =B5*B4+C5*C4
Summary of relationship between the LHS formulas of the constraints and their spreadsheet representations LHS formula for the pump constraint: 1 X1 + 1 X2 Formula in cell D8: =B8*B4+C8*C4 LHS formula for the labor constraint: 9 X1 + 6 X2 Formula in cell D9: =B9*B4+C9*C4 LHS formula for the tubing constraint: 12 X1 + 16 X2 Formula in cell D10: =B10*B4+C10*C4
Representing the Bounds on the Decision Variables How Solver Views the Model • 1. Target cell--the cell in the spreadsheet that represents the objectivefunction in the model (and whether its value should be maximized or minimized) • 2. Changing cells--the cells in the spreadsheet that represent the decision variables in the model • 3. Constraint cells--the cells in the spreadsheet that represent the LHS formulas of the constraints in the model (and any upper and lower bounds that apply to these formulas)
Using Solver • After implementing an LP model in a spreadsheet, we still need to solve the model. • To do this we must first indicate to Solver which cells in the spreadsheet represent the objective function (or target cell), the decision variables (or changing cells), and the constraints (or constraint cells).
Defining the Target Cell • In the Solver Parameters dialog box, specify the location of the cell that represents the objective function by entering it in the Set Target Cell box
Defining the Changing Cells • If the decision variables were not in a contiguous range, we would have to list the individual decision variable cells separated by commas in the By Changing Cells box. • Whenever possible, it is best to use contiguous cells to represent the decision variables.
Defining the Constraint Cells • To define the constraint cells, click the Add button in the solver parameters box, then complete the Add Constraint dialog box. • In the Add Constraint dialog box, click the Add button again to define additional constraints. Click the OK button when you have finished defining constraints. • It is a good idea to keep constraints of a given type grouped in contiguous cells so you can select them at the same time.
Defining the Nonnegativity Conditions • To do this, we simply add another set of constraints to the model
Solving the Model • Click the Solve button in the Solver Parameters dialog box to solve the problem. • When Solver finds the optimal solution, it displays the Solver Results dialog box.