Download
1 / 47
1.22k likes | 2.68k Views
Location planning and analysis. Need for Location Decisions. Marketing Strategy Cost of Doing Business Growth Depletion of Resources. Nature of Location Decisions. Strategic Importance Long term commitment/costs Impact on investments, revenues, and operations Supply chains Objectives

E N D
Need for Location Decisions • Marketing Strategy • Cost of Doing Business • Growth • Depletion of Resources
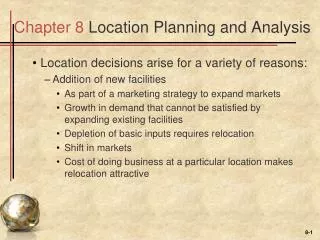
Nature of Location Decisions • Strategic Importance • Long term commitment/costs • Impact on investments, revenues, and operations • Supply chains • Objectives • Profit potential • No single location may be better than others • Identify several locations from which to choose • Options • Expand existing facilities • Add new facilities • Move
Making Location Decisions • Decide on the criteria • Identify the important factors • Develop location alternatives • Evaluate the alternatives • Make selection
Location Decision Factors Community Considerations Regional Factors Site-related Factors Multiple Plant Strategies
Regional Factors • Location of raw materials • Location of markets • Labor factors • Climate and taxes
Community Considerations • Quality of life • Services • Attitudes • Taxes • Environmental regulations • Utilities • Developer support
Site Related Factors • Land • Transportation • Environmental • Legal
Multiple Plant Strategies • Product plant strategy • Market area plant strategy • Process plant strategy
Trends in Locations • Foreign producers locating in another country • “Made in” effect • Currency fluctuations • Just-in-time manufacturing techniques • Microfactories • Information Technology
3+1 methods to evaluate location alternatives Locational Cost-Profit-Volume Analysis Factor rating The Center of Gravity method The transportation model
Locational Cost-Profit-Volume Analysis • Numerical and graphical analysis are both feasible. We focus on the graphical one. • The steps: • Determine the fixed and variable costs for each location • Plot the total-cost lines for all location alternatives on the same graph • Determine which location will have the lowest total cost for the expected level of output. Alternatively, determine which location will have the highest profit.
Assumptions of the CPV Analysis • Fixed costs are constant for the range of probable output • Variable costs are linear for the range of probable output • The required level of output can be closely estimated • Only one product is involved
Cost Total cost = VC + FC Total variable cost (VC) Fixed cost (FC) 0 Q (volume in units) The total cost curve • TC = FC + VC = FC + v*Q
Alternatively, the total profit is • TP = Q * (R – v) – FC
Calculatethebreak-even output levels • For B and C: 100,000 + 30*Q = 150,000 + 20*Q Q = 5,000 • For C and A: 150,000 + 20*Q = 250,000 + 11*Q Q = 11,111
Factor rating • Can be used for a wide range of problems • The procedure: • Determine the relevant factors • Assign a weight to each factor, indicating its importance (usually 0-1) • Decide on a common scale of the factors and transform them to that scale • Score each location alternative • Multiply the factor weight by the score for each factor and sum the results for each location • Choose the alternative with the highest composite score
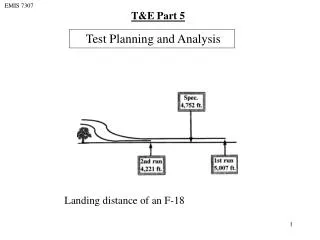
The Center of Gravity method • Its aim is to determine the location of a facility that will minimize the shipping cost or travel time to various destinations. • Frequently used in determining the location of schools, firefighter bases, public safety centres, highways, distribution centres, retail businesses…
Assumptions • The distribution cost is a linear function of the distance and the quantity shipped • The relative quantity shipped to each destination is fixed in time
Map and coordinates • A map is needed that shows the locations of destinations • A coordinate system is overlaid on the map to determine the coordinates of each destination • The aim is to find the coordinates of the optimal location for the facility, as a weighted average of the x and y coordinates of each destinations, where the weights are the shipped quantities. This is the centre of gravity.
The transportation model A special case of the linear programming model
The transportation problem • …involves finding the lowest-cost plan for distributing stocks of supplies from multiple origins to multiple destinations that demand them.
The optimal shipping plan • The transportation model is used to determine how to allocate the supplies available at the origins to the customers, in such a way that total shipping cost is minimized. • The optimal set of shipments is called the optimal shipping plan. • There can be more optimal shipping plans. • The plan will change if any of the parameters changes significantly.
A possible transportation problem situation D D S S D S D
Defining the classic transportation problem • The goods have more shipping points (suppliers) and more destinations (buyers). • Prices are fixed. • The sum of the quantities supplied and the sum of quantities demanded are equal. There are no surpluses nor shortages. • ai and bj are both positive (there are no reverse flow of goods) • the dependent variables are the transported quantities form origin i to destination j: xij≥ 0 • All of the supplies should be sold and all of the demand should be satisfied. • Tha aim is to minimize the total transportation cost: • Homogeneous goods. • Shipping costs per unit are constant. • Only one route and mode ofg transportation exists between each origin and each destination.
Typical areas of transportation problems • Suppliers of components and assembly plants. • Factories and shops. • Suppliers of raw materials and factories. • Food processing factories and food retailers.
Informations needed to built a model • A list of the shipping points with their capacities (supply quantities). • A list of the destinations with their demand. • Transportation costs per unit from each origin to each destination • Question: what if prices of the good are differ form supplier to supplier?
Surplus • If the total supply is greater than the total demand, than we have to add a ‘phantom’ destination to the model the demand of which is equal to the surplus. • The transportation cost to this phantom destination is 0 from every supplier. • De quantities shipped to this virtual customer will be those that will not be bought by anybody.
Shortages The formal solution is the same as it was in the case of a surplus (with 0 transportation costs): But: mathematics are less adequate in the case of shortages than in the case of surplusses, because of the consequences.
Solving transportation problems • Never try without a computer • There can be many equivalent solutions (with the same total cost).